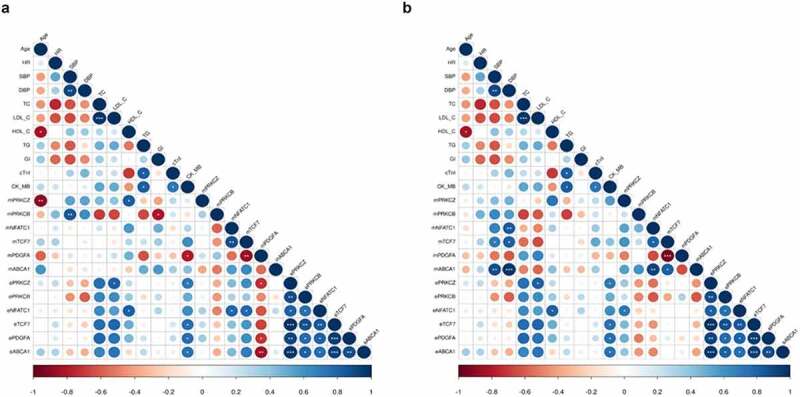
Figure 8.

Correlation plots. Pearson’s correlation between (a) CD4+ T and (b) CD8+ T cell promoter methylation and total PBMNCs gene expression levels of the selected DMGs with clinical and biochemical parameters of ACS patients. The circle size is scaled by the correlation coefficient. Blue and red colours designate positive and negative correlations, respectively (*P < 0.05; **P < 0.01; ***P < 0.001).
ABCA1: ATP Binding Cassette Subfamily A Member 1; CK_MB: creatine kinase MB isoenzyme; cTnI: cardiac troponin I; DBP: diastolic blood pressure; Gl: glycaemia; HDL_C: high-density lipoprotein cholesterol; HR: heart rate; LDL_C: low-density lipoprotein cholesterol; NFATC1: nuclear factor of activated T cells 1; PRKCB: protein kinase C beta; PRKCZ: protein kinase C zeta; TCF7: Transcription Factor 7; SBP: systolic blood pressure; TC: total cholesterol; TG: triglycerides.
