
Figure 1.
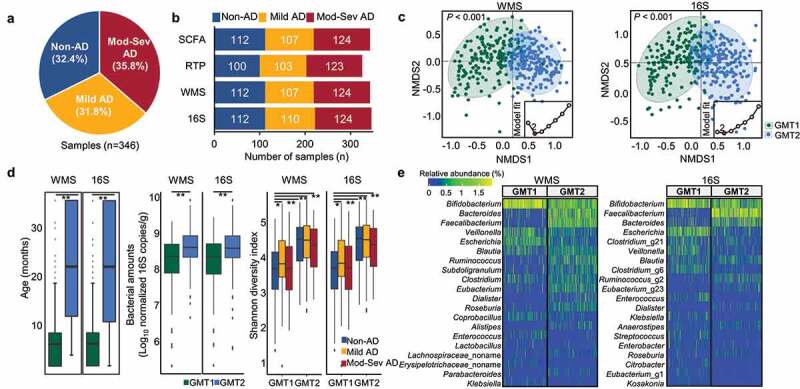
Summary of the analyzed data and comparison of the gut microbiota between clusters determined by Dirichlet multinomial mixture (DMM) modeling. (a) Overview of the studied samples. (b) Number of samples analyzed for each dataset. We analyzed 346 16S rRNA gene amplicon sequencing (16S), 343 whole metagenome sequencing (WMS), 326 quantitative real-time PCR (RTP), and 343 short-chain fatty acids (SCFA) profiles. (c) Microbiota clusters determined by DMM modeling in WMS and 16S dataset. The lowest Laplace approximation indicated that the number of clusters was two for gut microbiota data (inner graph). Two gut microbiota types (GMT1 and GMT2) were clearly distinguished in the NMDS plot (P < .001). (d) Comparison of age, bacterial amounts, and diversity between GMT1 and GMT2. (e) Heatmap of the relative abundance of the top 20 genera within two clusters. Mod-Sev AD: moderate to severe AD.*P < .05, **P < .01, ***P < .001.