
Figure 2.
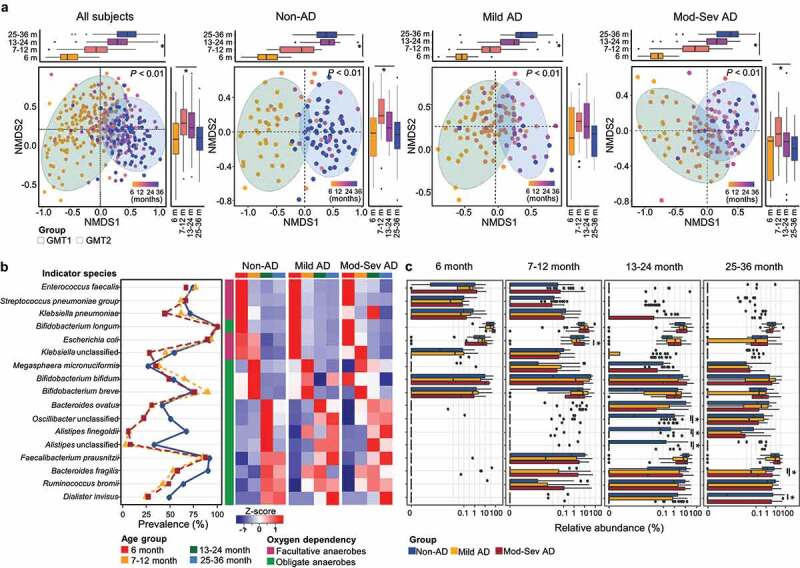
Age-dependent shifts of the gut microbiota in each group. (a) Variation in the gut microbiota according to age in all subjects, non-AD, mild AD, and moderate to severe AD groups were analyzed using NMDS plots based on the species-level Bray–Curtis dissimilarity. The boxplot shows the variation of Bray–Curtis dissimilarity among age groups for each axis. (b) Shifts of indicator species for each age throughout early childhood. Heatmap shows the comparison of the indicator’s relative abundance according to age. Color codes for the age groups and the characteristics of oxygen dependency are listed below the figure. (c) Comparison of the relative abundance of each indicator among groups according to age. Mod-Sev AD: moderate to severe AD. *q < 0.05.