
Figure 4.
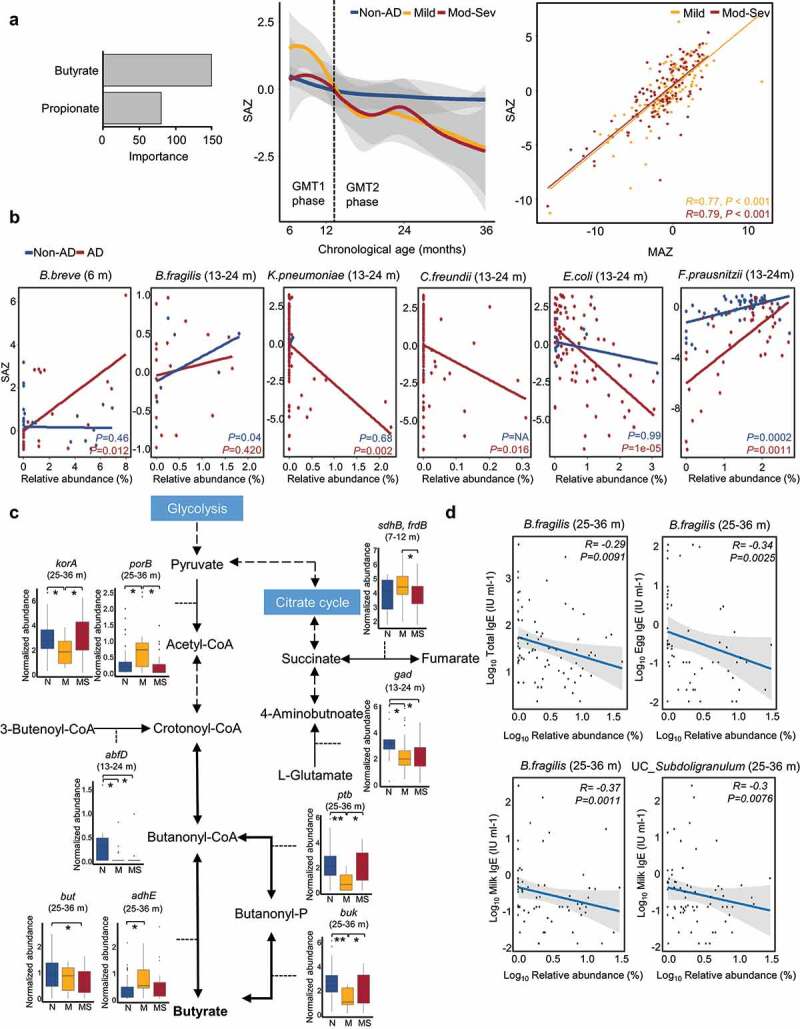
Dysbiosis of short-chain fatty acids (SCFAs) profiles in AD groups throughout early childhood. (a) Dysbiosis of SCFAs profiles in AD groups according to age. The alteration of SCFAs in AD groups was analyzed using the prediction model of SCFAs changes according to age in 112 non-AD samples. The importance of butyrate and propionate for the prediction model was determined using subjects without AD. The SCFAs-by-age z-score (SAZ) was calculated to identify dysbiosis of SCFA profiles in AD groups along with age. The gray area represents the 95% confidence intervals (CIs). The correlation between SAZ and MAZ was determined by linear regression models and the Pearson correlation test. (b) Species that are significantly associated with the dysbiosis of SCFAs (SAZ score) in AD groups at each age. (c) Comparison of gene families involved in butyrate metabolism among groups. The boxplot shows the significantly different gene families between the non-AD and AD groups. (d) Correlation between the relative abundances of significantly associated species with abnormal MAZ or SAZ in AD groups and IgE levels. Bacteroides fragilis and unclassified (UC)_Subdoligranulum were detected as associated species with P-value < 0.01. Mod-Sev AD: moderate to severe AD. N: non-AD, M: mild AD, and MS: moderate to severe AD. *q < 0.05, **q < 0.01.