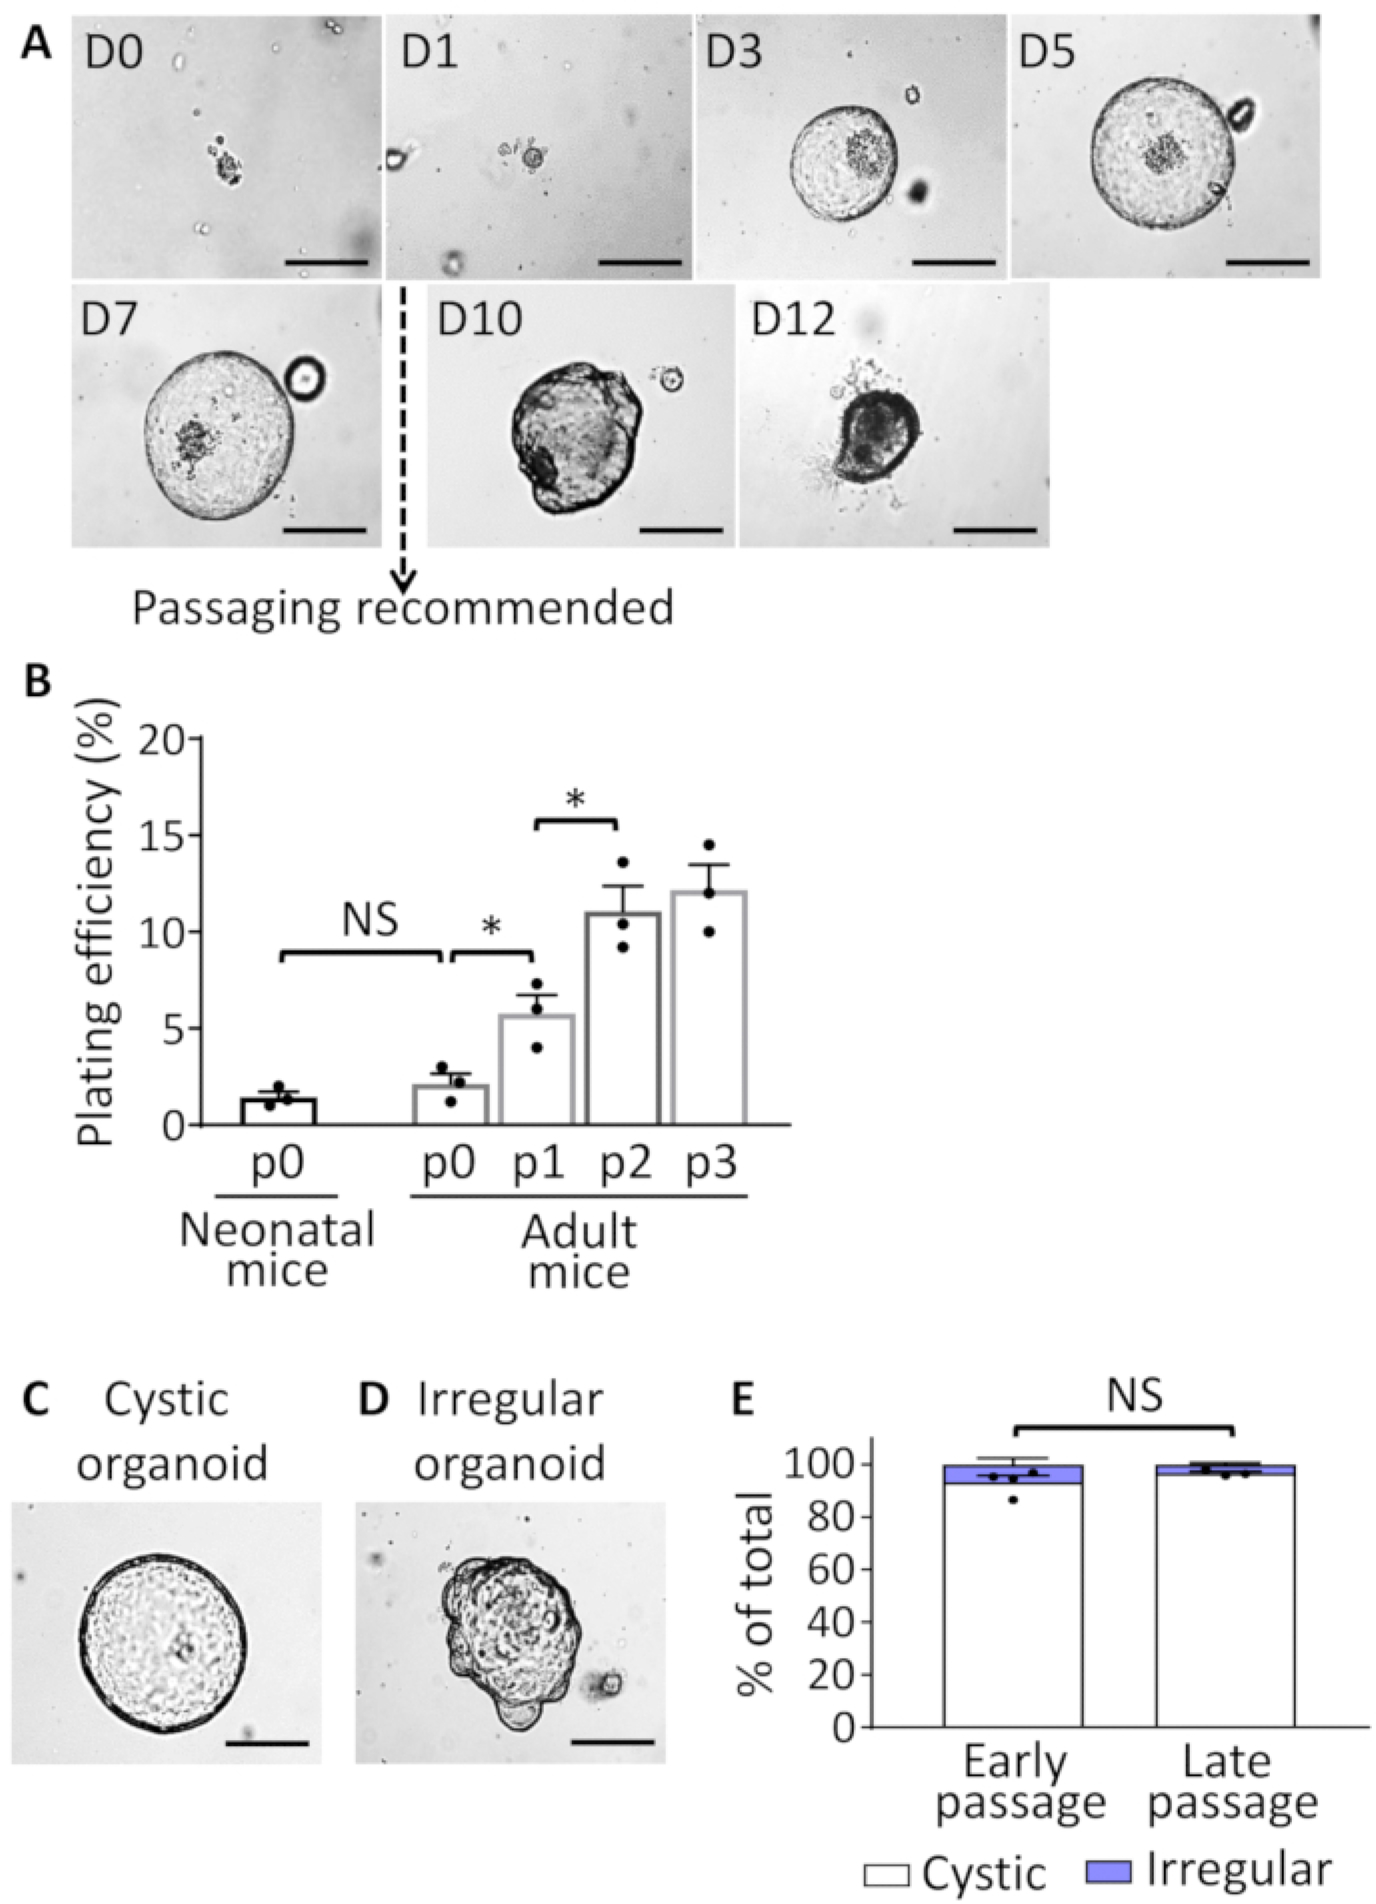
Figure 2: EHBDO culture.

(A). Microscopic images of EHBDOs over a 12-day course. (B). Plating efficiency of organoids derived from the neonatal (2 mice per culture, n = 3 cultures) and adult (>2 months old, 1 mouse per culture, n = 3 cultures) mice after plating 300 cells per well in 24-well plate and enumerating established organoids on day 5 of culture. (C and D) EHBDO cystic versus irregular morphology was analyzed by microscopy. (E). The percent of cystic and irregular shaped organoids was analyzed in early (<10) and late (≥10) organoid passages. Scale bars = 500 μm. Quantitative data showed as mean +/− standard error of the mean (SEM), t-test. NS = not significant.
