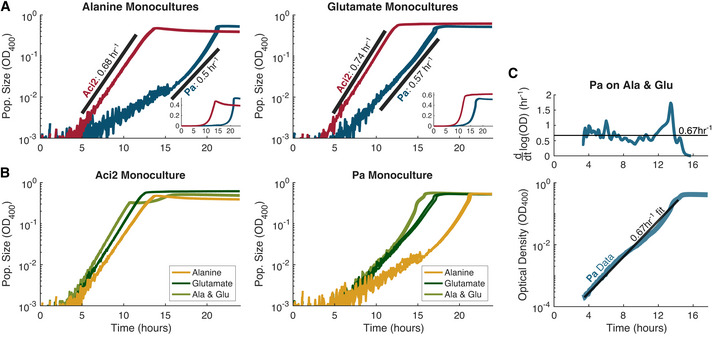
Figure EV1. Pa is the single‐resource slow‐grower and should be considered the slow‐grower despite some fluctuations in its apparent growth rate.

- Monoculture growth rate experiments in single resource environments for Aci2 in red and Pa in blue with growth rate fits shown in black. Insets show the same data on a linear scale. On alanine, Pa has a distinct upwards curvature to its growth curve. This could represent a density‐dependent growth rate with a peak instantaneous growth rate close to Aci2’s. Pa should nevertheless be considered the slow‐grower because for the majority of its growth it is growing much slower than Aci2 and its increase in growth rate occurs over only the last ~2 h before it saturates. The value of 0.5/h is representative across its growth.
- Direct comparisons of each species’ growth in each environment highlights similarity of growth rates across environments and in particular the similarity of the glutamate growth rates to the two‐resource growth rates, which is especially relevant because in competition glutamate is the resource that is most often being switched to.
- Pa’s two‐resource growth rate fit from Fig 2A extended across the entirety of the data. Although Pa’s measured growth rate has some small fluctuations, the growth rate fit of 0.67/h is a good overall fit. The spike in growth rate around 13 h is discussed in Appendix Fig S5, which also presents reasons why Pa’s optical density may not be a constant function of its biomass or population size and why modeling the small variations would likely be overfitting to experimental artifacts and not actual growth dynamics.
