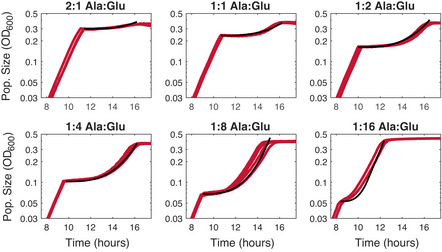
Figure EV2. Example lag time fits.

The Aci2 monoculture data from Fig 2B are shown in red with the fits used to produce the lag time estimates shown in red (Materials and Methods). The remaining Aci2 fits are presented in Appendix Fig S3. The Pa fits are presented in Appendix Fig S4 with a note on interpretation of Pa’s optical density data provided in Appendix Fig S5. These fits were performed using the species’ two‐resource growth rates as their post‐recovery steady‐state growth rates to maintain consistency with modeling decisions. Fits using the species’ single‐resource growth rates are provided in Appendix Fig S7 and differ only slightly.
