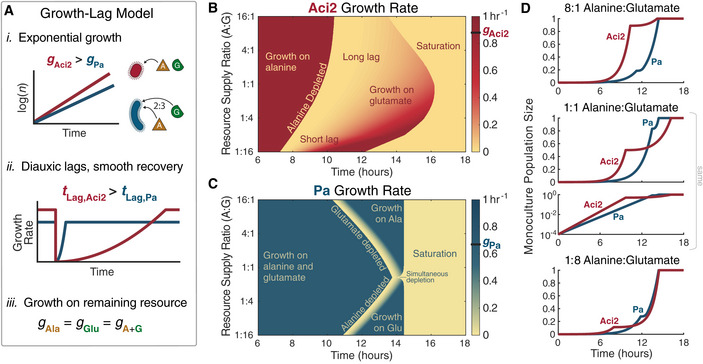
Figure 3. Growth‐lag model reproduces monoculture growth dynamics.

- A simple model of growth and lag phases. (i) Species initially grow exponentially with Aci2 initially consumes only alanine and Pa consuming alanine and glutamate in a fixed 2:3 ratio. (ii) When a resource is depleted, both species experience a diauxic lag. Aci2’s lag time is long and varies with resource supply. Pa’s lag is short and constant at 1 h. Growth rates recover with a quadratic time dependence. (iii) Once recovered from its diauxic lag, each species grows on the remaining resource at its initial growth rate. (Modeling details in Materials and Methods.)
- Model predictions for Aci2’s monoculture growth for different resource supply ratios when started at a 104 dilution from carrying capacity. Each row of pixels is the calculation for a separate condition.
- The equivalent predictions for Pa’s growth.
- Comparison of the monoculture growth calculations at 8:1, 1:1, and 1:8 resource supply ratios. The appearance of initial lag is due to the growth that needs to happen before population sizes become significant on a linear scale. Population sizes are presented in dimensionless units (Materials and Methods).
