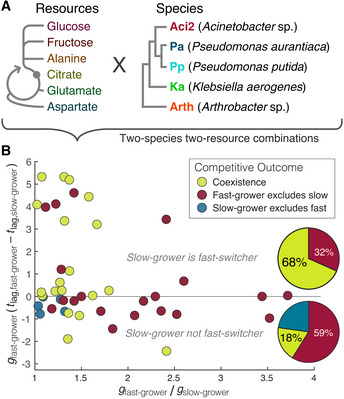
Figure 6. Slow‐growers are more likely to coexist with fast‐growers when the slow‐growers are fast‐switchers.

- We selected six resources and five species for additional experiments. Resources are shown in relation to glycolysis and the citric acid cycle. Species are shown with a phylogenic tree with connections in the correct order but not to scale.
- Monoculture experiments were performed to determine species’ growth rates and lag times for each two‐resource environment. For each pair of species, coculture competition experiments were performed in each two‐resource environment, and qualitative competitive outcomes were determined (Materials and Methods). There were 44 competitions in which both species could be assigned growth rates and lag times (Fig 6 Source Data). Each point represents one competition. Pie charts summarize the competitive outcomes for cases in which the slow‐grower was the fast‐switcher (above the Δt lag = 0 line) and in which the slow‐grower was not the slow‐switcher (on and below Δt lag = 0).
Data Information: All monoculture data with growth rate and lag time fits, all competition data, and notes on specific competitions are available in the source data.
Source data are available online for this figure.
