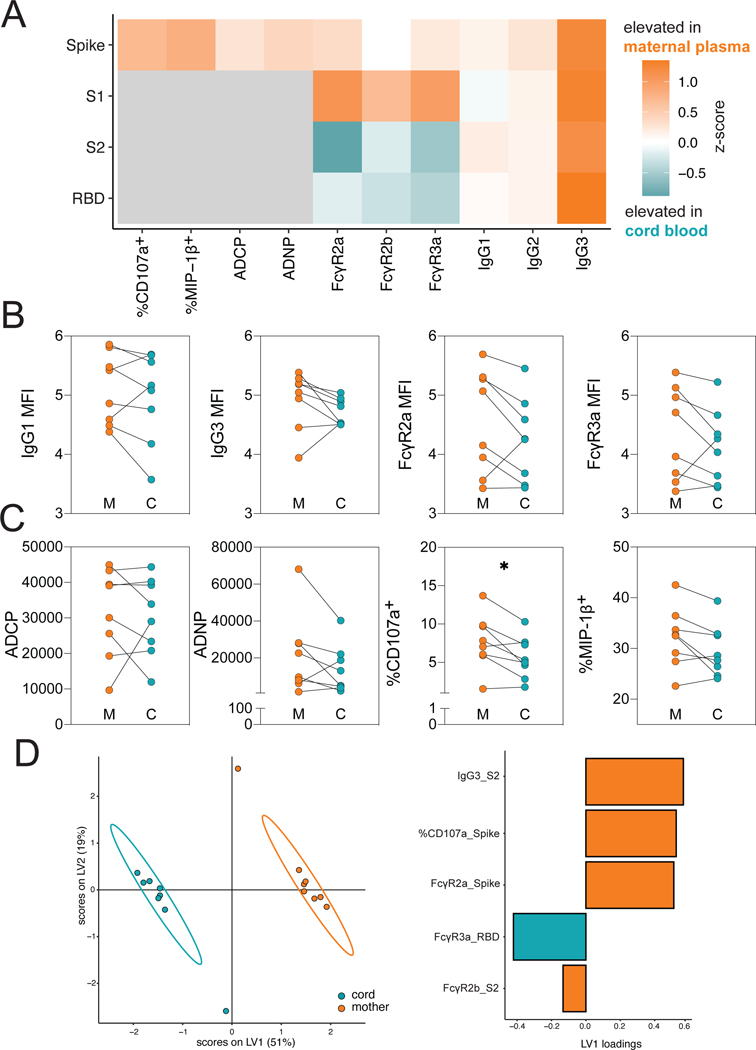
Figure 2. Vaccination results in the transfer of FcR-binding antibodies into the cord blood.
A. The heatmap shows the difference in median z-score between maternal plasma and cord blood (n = 8 for both maternal and cord) for each SARS-CoV-2-specific feature. Orange indicates the feature was elevated in maternal plasma, and teal indicates that the features was elevated in cord blood. Gray boxes indicate that the experiment was not performed. Significance was measured by a Mann-Whitney U test and p-values were Benjamini-Hochberg adjusted. No significant differences were observed.
B. The dot plots show the IgG1, IgG3, FcγR2a-binding and FcγR3a-binding titer against spike protein for maternal (M) and cord (C) blood. Lines connect maternal:cord dyads (n = 8). Significance was determined by Wilcoxon-matched pairs signed rank test.
C. The dot plots show the ADCP, ADNP and ADNKA (CD107a+ or MIP-1β+) functional titers against spike protein for maternal (M) and cord (C) blood. Lines connect maternal:cord dyads (n= 8). * p <0.05.
D. A multilevel partial least-squares discriminant analysis (mPLSDA) was built using maternal or cord LASSO-selected SARS-CoV-2-specific features. The dot plot (left) shows the scores of each sample, with the ellipses representing the 95% confidence interval for each group (n = 8 for both groups). The bar plot (right) shows the loadings of each LASSO-selected feature for the mPLSDA. The color of the bar indicates in which group the feature is enriched.

