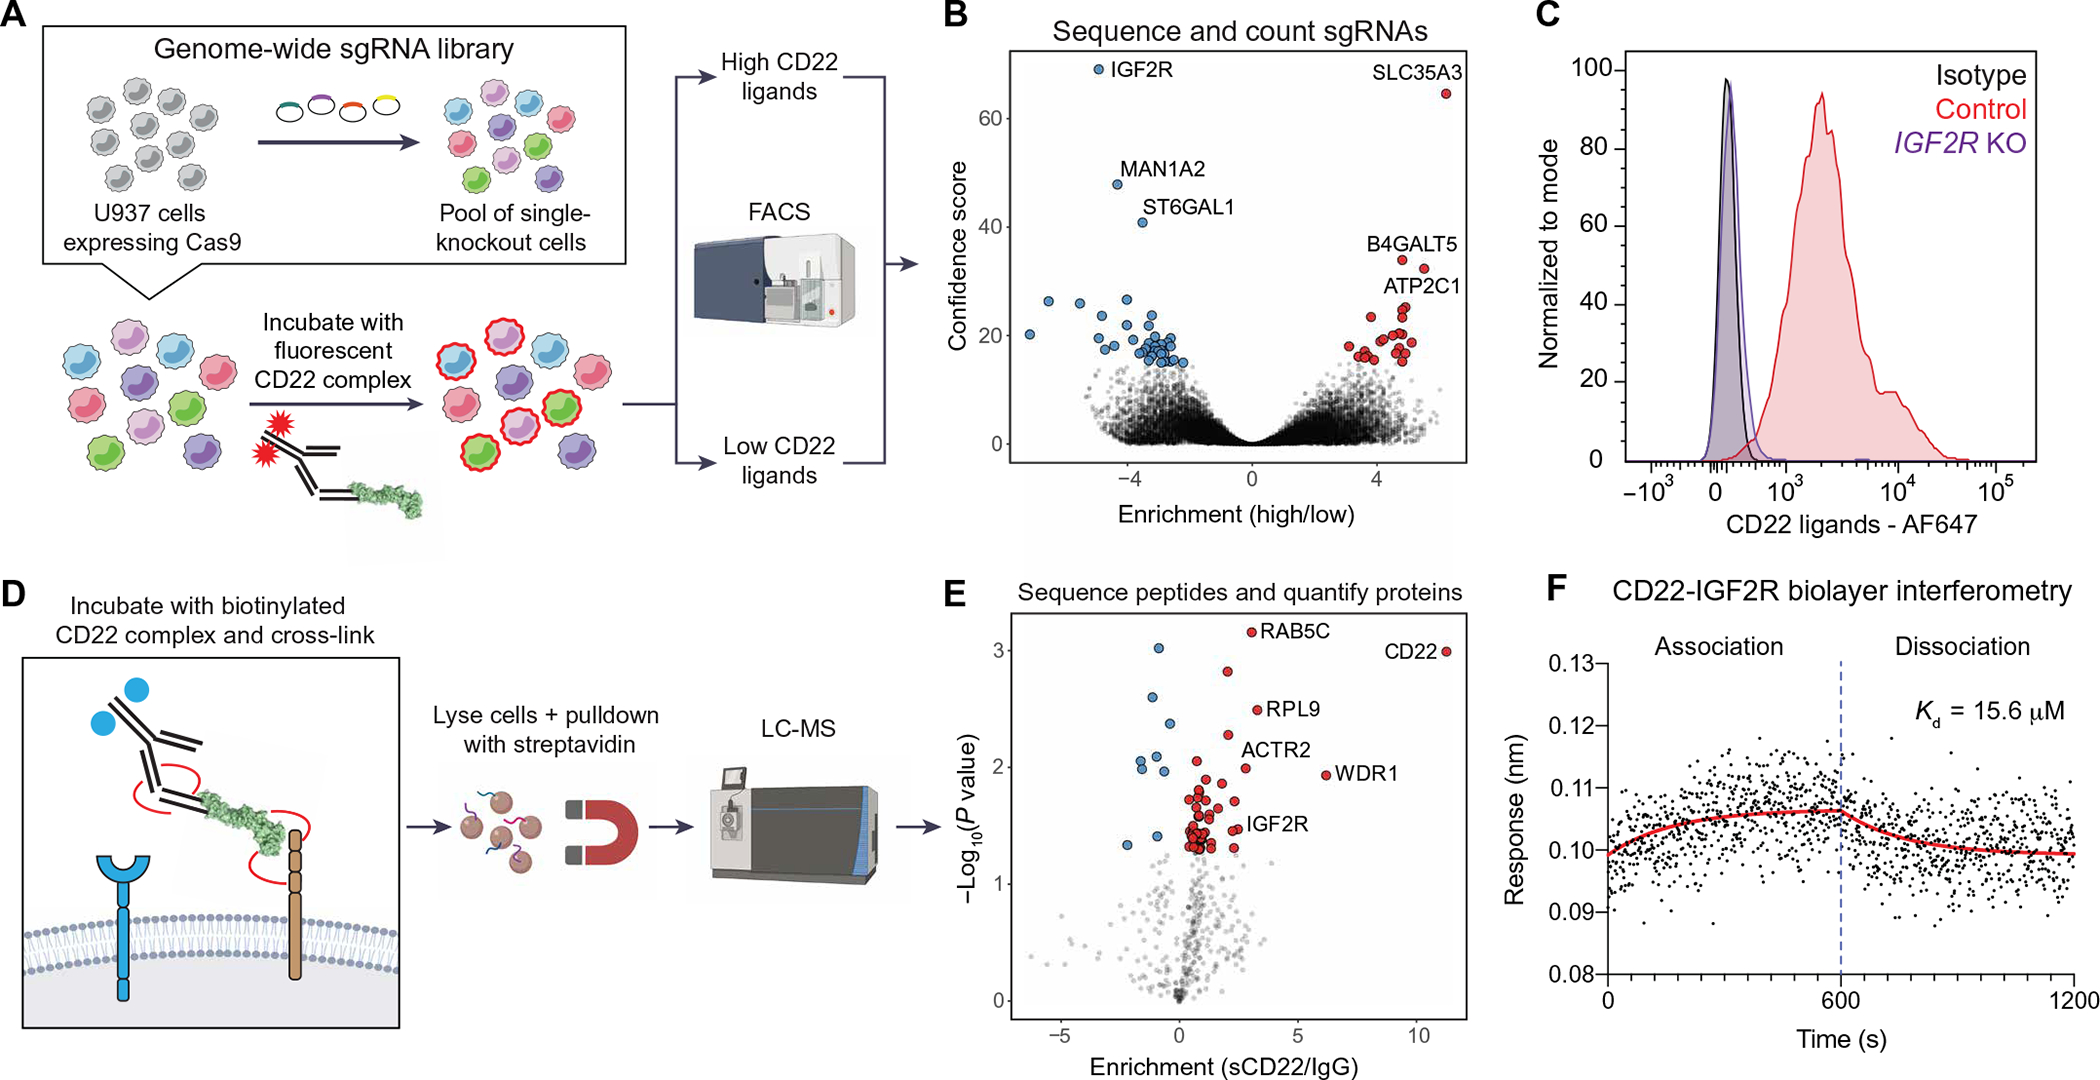
Fig. 2. Genetic and proteomic screens elucidate CD22-IGF2R interaction.

(A) Schematic of CRISPR-Cas9 screen for genetic modifiers of sCD22 binding. (B) Volcano plot of hits from CRISPR-Cas9 screen, highlighting KOs that inhibit CD22 binding (blue) and promote CD22 binding (red). (C) Flow cytometry analysis of CD22 ligand expression on U937 cells infected with a safe-targeting sgRNA (control, red) or an IGF2R-targeting sgRNA (purple). Isotype control–stained WT cells are shown in gray. AF647, Alexa Fluor 647. (D) Schematic of affinity purification LC-MS screen for direct binding partners of sCD22. (E) Volcano plot of hits from affinity purification LC-MS screen, highlighting proteins enriched in the CD22-bound fraction (red). (F) Kinetics of the CD22-IGF2R interaction determined by biolayer interferometry. Red line shows nonlinear fit of association-dissociation curve. Kd, dissociation constant.
