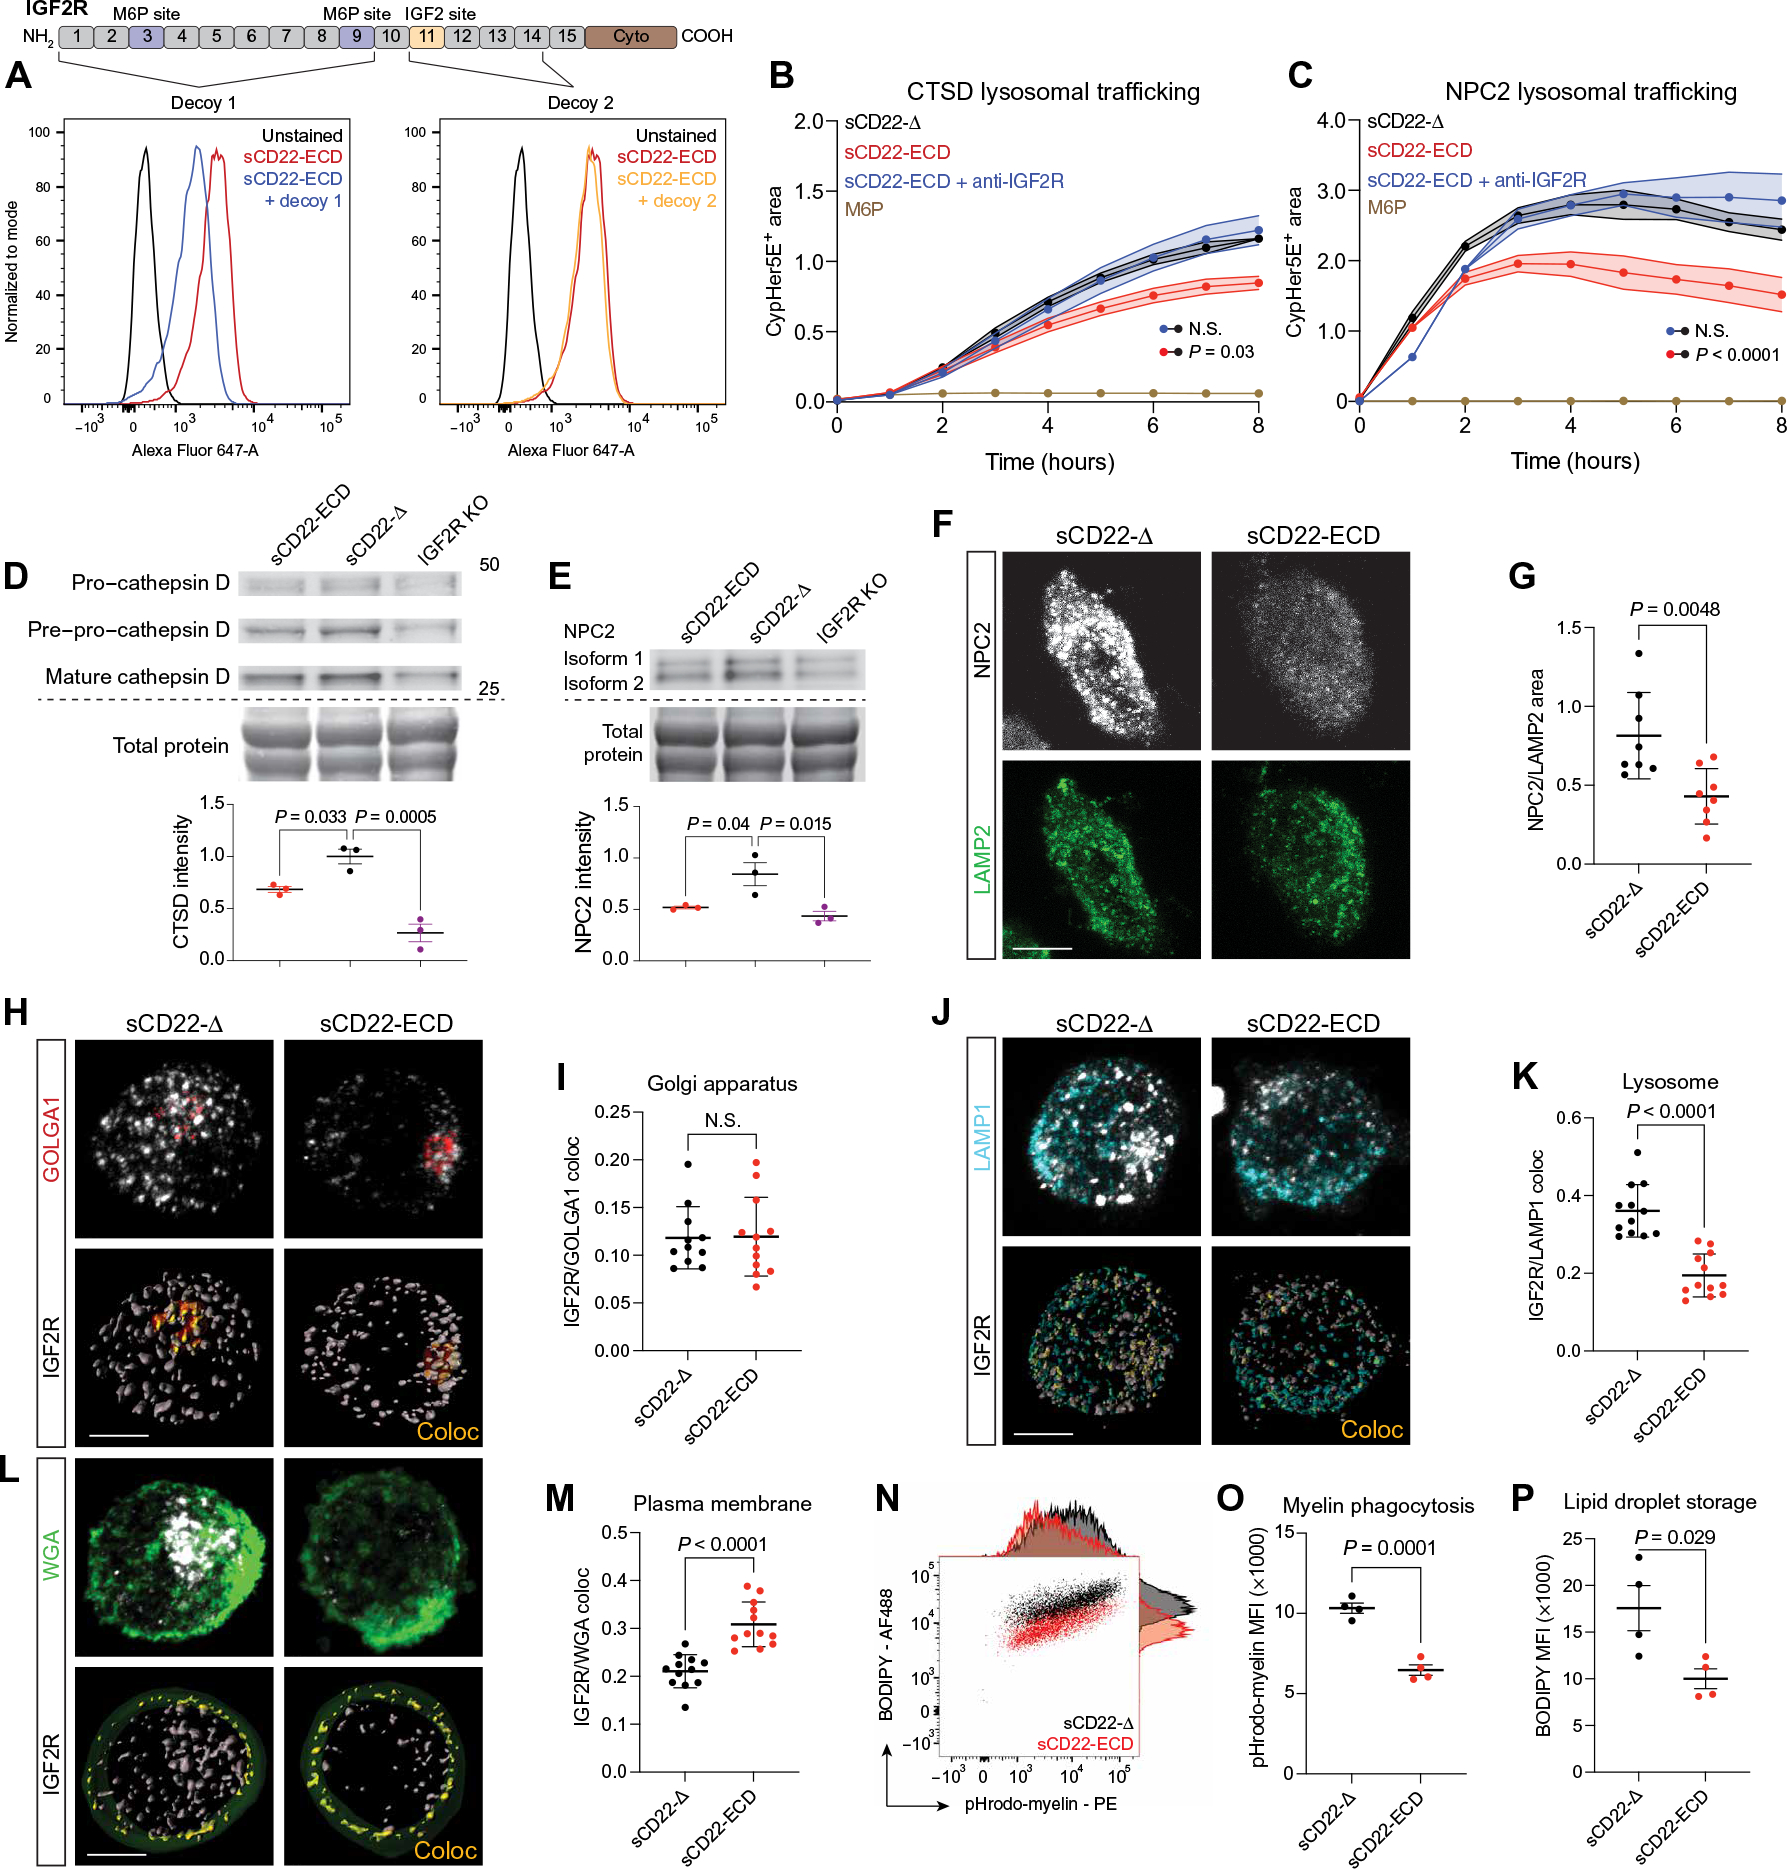
Fig. 3. CD22 impairs M6P-dependent lysosomal trafficking.

(A) Flow cytometry analysis of U937 cells stained with sCD22-ECD alone (red) or sCD22 precomplexed with a decoy peptide comprising the M6P-binding sites (blue) or the IGF2 site (orange) on IGF2R. (B) Time-lapse fluorescence microscopy analysis of cathepsin D trafficking to lysosomes in U937 cells treated with sCD22-Δ (black), sCD22-ECD (red), sCD22-ECD, and anti-IGF2R (blue) or saturating amounts of M6P (brown) (n = 3, ANOVA, means ± SEM). N.S., not significant. (C) Time-lapse fluorescence microscopy analysis of NPC2 trafficking to lysosomes in U937 cells treated with sCD22-Δ (black), sCD22-ECD (red), sCD22-ECD and anti-IGF2R (blue), or saturating amounts of M6P (brown) (n = 2, ANOVA, means ± SEM). (D) Western blot analysis of CTSD proteoform expression in WT and IGF2R KO U937 cells treated with sCD22-ECD or sCD22-Δ for 24 hours. Equal loading was confirmed across lanes by total protein stain (n = 3, one-way ANOVA, means ± SEM). (E) Western blot analysis of NPC2 expression in WT and IGF2R KO U937 cells treated with sCD22-ECD or sCD22-Δ for 24 hours. Equal loading was confirmed across lanes by total protein stain (n = 3, one-way ANOVA, means ± SEM). (F) Representative images of NPC2 (gray) and LAMP2 (green) expression in U937 cells treated with sCD22-Δ or sCD22-ECD. Scale bar, 5 μm. (G) Proportion of NPC2+ area to LAMP2+ area in U937 cells treated with sCD22-Δ or full-length sCD22-ECD (n = 8, t test, means ± SD). (H) Representative images of IGF2R (gray) colocalization (Coloc) (yellow) with the Golgi marker GOLGA1 (red) in U937 cells treated with sCD22-Δ or sCD22-ECD. Scale bar, 5 μm. (I) Proportion of IGF2R localized to the Golgi in U937 cells treated with sCD22-Δ or sCD22-ECD (n = 3 biological replicates, three to four cells quantified per replicate, t test, means ± SD). (J) Representative images of IGF2R (gray) colocalization (yellow) with the lysosomal marker LAMP1 (cyan) in U937 cells treated with sCD22-Δ or sCD22-ECD. Scale bar, 5 μm. (K) Proportion of IGF2R localized to the lysosome in U937 cells treated with sCD22-Δ or sCD22-ECD (n = 3 biological replicates, two to three cells quantified per replicate, t test, means ± SD). (L) Representative images of IGF2R (gray) colocalization (yellow) with wheat germ agglutinin (WGA) cell surface staining (green) in U937 cells treated with sCD22-Δ or sCD22-ECD. Scale bar, 5 μm. (M) Proportion of IGF2R localized to the cell surface in U937 cells treated with sCD22-Δ or sCD22-ECD (n = 3 biological replicates, three to four cells quantified per replicate, t test, means ± SD). (N) Flow cytometry analysis of iMGLs treated with sCD22-Δ or sCD22-ECD, incubated with pHrodo-myelin for 24 hours, and stained with BODIPY, with corresponding histograms. (O) Quantification of phagocytosis by pHrodo-myelin mean fluorescence intensity (MFI) in iMGLs treated with sCD22-Δ or sCD22-ECD (n = 4, t test, means ± SEM). (P) Quantification of lipid droplet storage by BODIPY MFI in iMGLs treated with sCD22-Δ or sCD22-ECD (n = 4, t test, means ± SEM).
