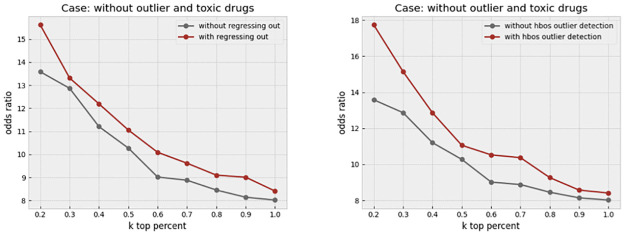
Fig 14. Effect of regressing-out and cell outlier detection.
The left plot shows the increase in the odds ratio by regressing out the cell area from all other features in different k percentages when outlier and toxic drugs were removed. Improvement in the odds ratio becomes more significant when the toxic drugs are excluded from the analysis. The right plot shows that using histogram-based outlier detection improves the result in the same baseline case, where the outlier and toxic drugs were removed.

