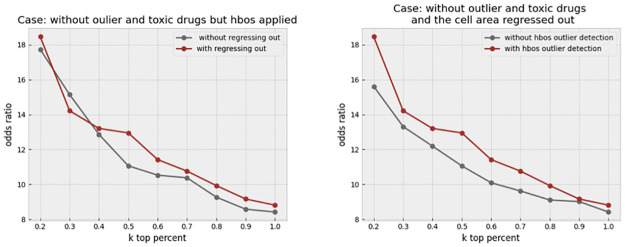
Fig 15. The combined effect of outlier detection and regressing-out.
The left plot shows the effect of regressing out when all other preprocessing steps (outlier and toxic drug removal, and cell outlier removal) are applied. The right plot shows the effect of cell outlier removal when all other steps, including outlier and toxic drug removal and regress-out, have been applied. Cell outlier removal seems to provide a more consistent improvement across values of k compared to the regress-out technique.

