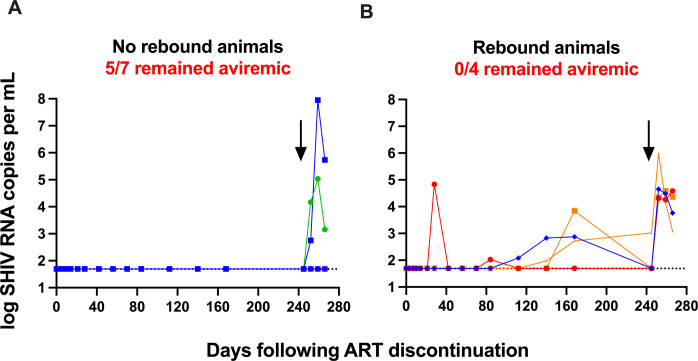
Fig 7. CD8+ cell depletion.
Plasma viral loads before and after CD8+ cell depletion in (A) animals with no viral rebound (n = 7) and (B) animals with viral rebound (n = 4) following ART discontinuation. Numbers of animals that remained aviremic and total number of animals are shown. Arrows indicate CD8+ cell depletion on day 245 (week 77) after ART discontinuation. Dotted lines indicate limit of detection, values on the line were below limit of detection. Individual symbol and color coding as indicated in S1 Table.

