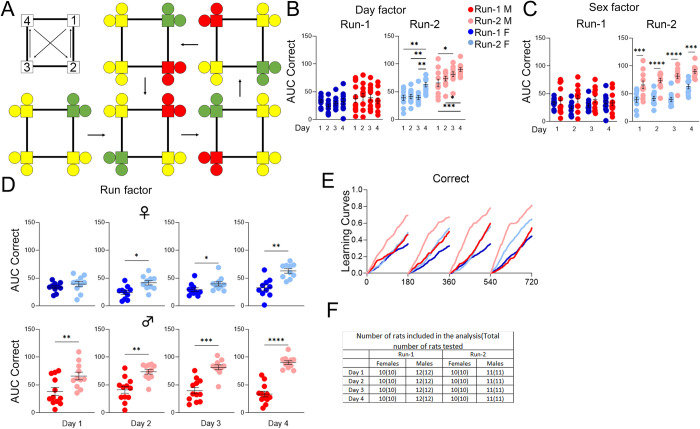
Fig 6. Place learning with corner switch, cohort B.
(A) On the top left is the cycle of correct corners with movement every 45 minutes. The rest of the panel, starting from the bottom left, depicts an example of correct (green) and incorrect (yellow, or red highlighting the previously correct corner) layouts for a rat initially assigned to corner 1 and their cycle over the four phases of a drinking session, which ends with the top right layout before returning to the top center layout during the start of the next drinking session. (B) Day factor, (C) Sex factor and (D) Run factor comparisons of area under the curve (AUC) for correct visit activity curves of individual animals by sex, program day, and Run. (E) Activity curves showing the fractional accumulation (y-axis) of correct visits over drinking session time (x-axis), reset every 180 minutes, by sex and Run. (F) For Run-1, 12 male and 10 female rats were tested since 2 females died just before the timeline started. All 22 rats were included in the analysis of Run-1. For Run-2, 11 male and 10 female rats were tested, since one male died during the time between Runs. All 21 rats were included in the analysis of Run-2. All data represented as mean ± SEM (*p < 0.05, **p < 0.01, ***p < 0.001, ****p < 0.0001,). See Tables 8 and 9 for statistical analysis. Males (M or ♂) are colored as red (Run-1) and light red (Run-2). Females (F or ♀) are colored as blue (Run-1) or light blue (Run-2).

