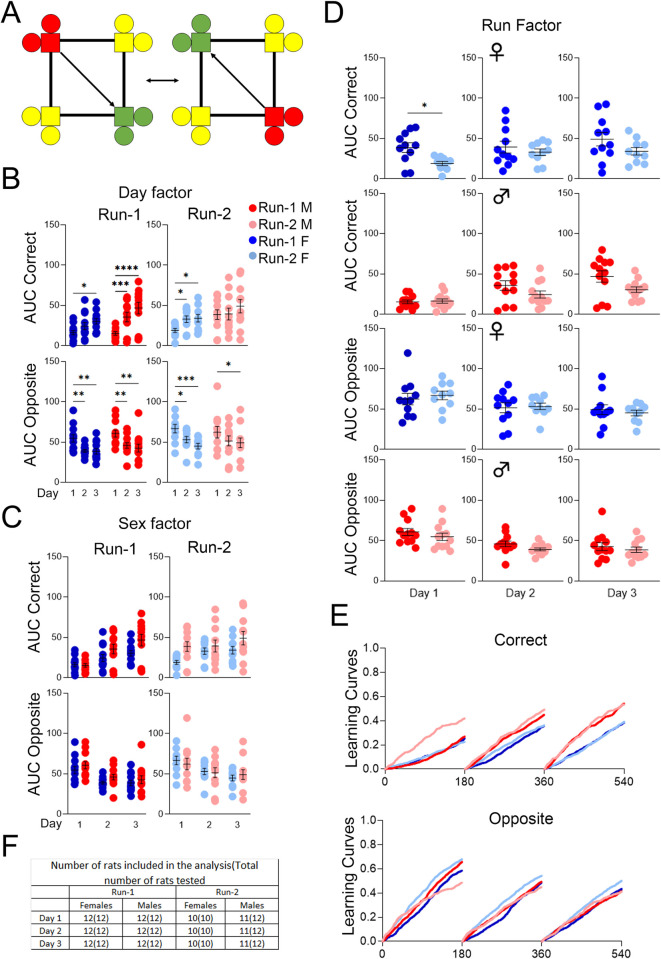
Fig 7. Behavioral sequencing, cohort A.
(A) Example of correct (green), lateral (yellow), and opposite (red) corner layouts and pattern for a rat initially assigned to either corner 2 or 4. (B) Day factor, (C) Sex factor and (D) Run factor comparisons of area under the curve (AUC) for activity curves of individual animals by sex, program day, and Run, separated by visit categories (Correct or Opposite). (E) Activity curves showing the fractional accumulation (y-axis) of correct visits or opposite visits over drinking session time (x-axis), reset every 180 minutes, by sex and Run. (F) For Run-1, 12 male and 12 female rats were tested. All 24 rats were included in the analysis of Run-1. For Run-2, 12 male and 10 female rats were tested, since two females died during the time between Runs. One male was excluded from Run-2 analysis because it visited corners less than 25 times during all 3 drinking sessions. All data represented as mean ± SEM (*p < 0.05, ** p < 0.01, *** p < 0.001, **** p < 0.0001). See Tables 10 and 11 for statistical analysis. Males (M or ♂) are colored as red (Run-1) and light red (Run-2). Females (F or ♀) are colored as blue (Run-1) or light blue (Run-2).

