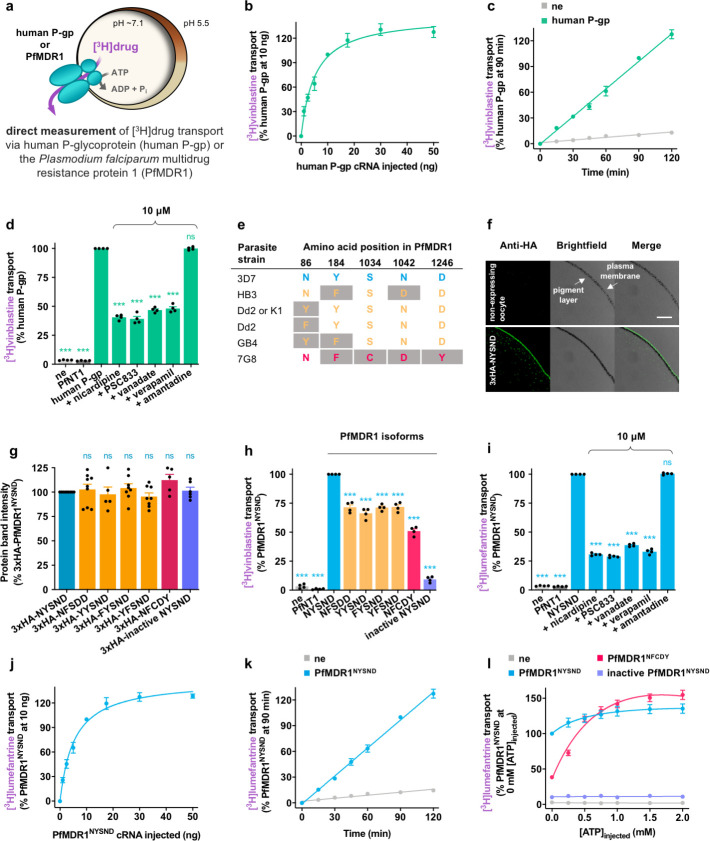
Fig 1. Heterologous expression of functional human P-gp and PfMDR1 in Xenopus oocytes.
(a) Schematic showing the transport of a [3H]drug via human P-gp or PfMDR1 in the Xenopus oocyte system. (b) The relationship between the quantity of human P-gp cRNA injected into the oocyte and the level of human P-gp–mediated [3H]vinblastine transport measured. (c) The transport of [3H]vinblastine via human P-gp was approximately linear with time for at least 2 hours. (d) The human P-gp–mediated efflux of [3H]vinblastine from oocytes was reduced by known inhibitors of the transporter (nicardipine, PSC8333, vanadate, and verapamil) and was unaffected by amantadine (a drug that does not interact with human P-gp). (e) The field isoforms of PfMDR1 characterized in this study. Residues that differ from the wild-type amino acid sequence are shaded gray. (f) Immunofluorescence microscopy images confirmed that PfMDR1 localized to the oocyte plasma membrane. The expression of 3xHA-tagged PfMDR1NYSND resulted in a fluorescent band external to the pigment layer, indicating that the protein was expressed at the oocyte surface. The band was not present in ne. The length of the scale bar is 50 μm. Images showing the presence of the other HA-tagged PfMDR1 isoforms at the oocyte surface are shown in S4 Fig. (g) Semiquantification of PfMDR1 protein levels in the membranes of oocytes expressing different 3xHA-PfMDR1 isoforms indicated that the 7 isoforms were expressed at similar levels. (h) The transport of [3H]vinblastine via PfMDR1. (i) The efflux of [3H]lumefantrine from oocytes expressing PfMDR1NYSND was reduced by nicardipine, PSC8333, vanadate, and verapamil and was unaffected by amantadine. (j) The relationship between the quantity of PfMDR1NYSND cRNA microinjected into the oocyte and the level of PfMDR1NYSND-mediated [3H]lumefantrine transport measured. (k) The transport of [3H]lumefantrine via PfMDR1NYSND was approximately linear with time for at least 2 hours. (l) Microinjection of additional ATP into the oocyte greatly stimulated [3H]lumefantrine transport via PfMDR1NFCDY. The data are the mean of n = 4 to 9 independent experiments, each yielding similar results and overlaid as individual data points in panels d, g, h, and i, and the error is the SEM. Where not visible, the error bars fall within the symbols. The asterisks denote a significant difference from human P-gp (panel d), 3xHA-PfMDR1NYSND (panel g), or PfMDR1NYSND (panels h and i); ***P < 0.001, ns, not significant (1-way ANOVA). The data underlying this figure is supplied in S3 Data. ne, nonexpressing oocytes; PfMDR1, Plasmodium falciparum multidrug resistance protein 1; P-gp, P-glycoprotein.

