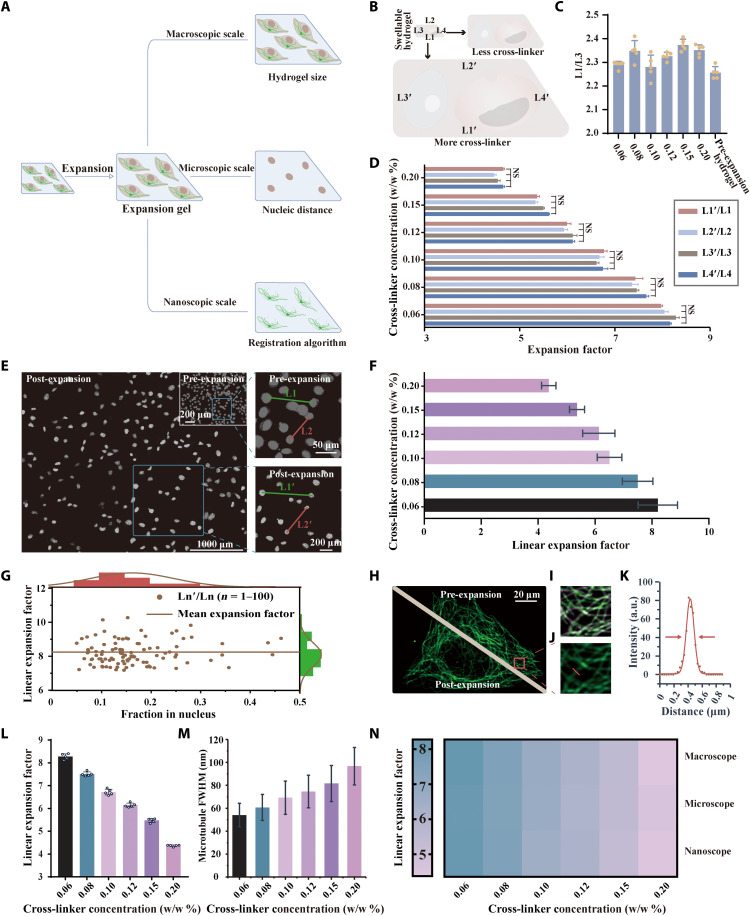
Fig. 2. Expansion ability of NIFS hydrogels with different EBIS cross-linker concentrations.
(A) Schematic diagram of three expansion factor evaluation methods. (B) The scheme highlights the swelling ability of hydrogels with different cross-linker concentrations in the macroscopic scale level. (C) The ratio between the hydrogel’s two directions (L1/L3) varies with cross-linker concentrations from 0.20% (w/w) to 0.06% (w/w) (mean ± SD; n = 5 biological replicates). (D) The macroscopic scale expansion ability of cell-embedded samples is determined by the hydrogel’s four sides’ ratio between the post- and pre-expansion hydrogels (mean ± SD; n = 5 biological replicates). (E) Cell nucleic images of pre- and post-expansion samples using NIFS hydrogels. The right images illustrate the nucleic pairwise analysis. (F) The microscopic scale expansion ability of cell-embedded samples is determined by nucleic distance. (G) Linear expansion factor [distance ratio between Ln′ and Ln (n = 1, 2, …, 100)] versus the fraction in nucleus [mean gray value of Ln′ (n = 1, 2, …, 100)]. (The brown line indicates mean expansion factor; mean ± SD = 8.21 ± 0.693.) (H) Representative microtubule images of pre- and post-expansion in the same cell. (I) Merged images of pre-expansion and algorithm-calculated post-expansion microtubule images. (Green is pre-expansion image; purple is algorithm-calculated post-expansion image.) (J) Enlarged view of the post-expansion tubulin image in the red box marked in (H). (K) Profile of red lines in (J) and the corresponding FWHM calculation by Gaussian fitting (red line). (L) Influence of the cross-linker concentrations on nanoscale expansion ability evaluated by registration algorithm of microtubule structure (mean ± SD; n = 5 biological replicates, each replicate chooses one region). (M) Microtubule’s FWHM is determined by post-expansion images with different cross-linker concentrations (mean ± SD; n = 300 microtubule profiles from three replicates; each replicate chooses one region). (N) The expansion factor comparison using three evaluation methods reaches consistent observations.

