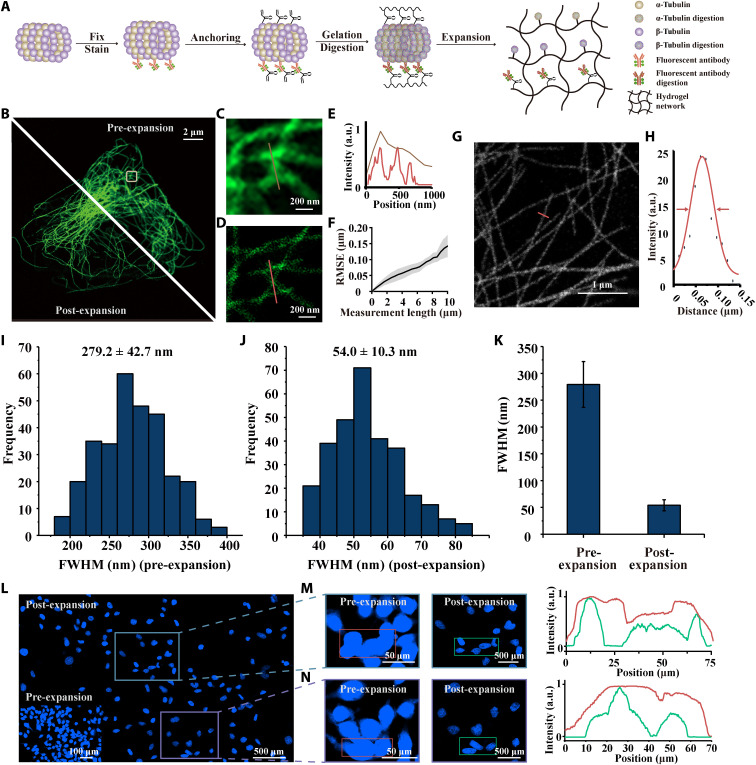
Fig. 3. The performance of optimized NIFS hydrogel for ExM.
(A) Schematic illustration of microtubule imaging pipeline using ExM. (B) Pre- and post-expansion microtubule images with the optimized NIFS hydrogel. The top right panel represents pre-expansion image, and the bottom left panel represents post-expansion image. (C) Magnified pre-expansion image of the box marked area in (B). (D) Magnified post-expansion image of the box marked area in (B). (E) Intensity profile of lines in (C) (brown line) and (D) (red line). (F) RMSE of NIFS hydrogel used in the expansion process. (Black line, mean value; gray scale, SD of three biological replicates). (G) Representative image (63×/1.40 NA) of post-expansion microtubules using optimized NIFS hydrogel. (H) Gaussian fitting of red line in (G) for FWHM calculation. (I) FWHM of microtubules (n = 300 microtubule profiles) in pre-expansion image. (J) FWHM of microtubules (n = 300 microtubule profiles) in post-expansion image. (K) Comparison of FWHM in pre- and post-expansion images. (L) Representative nucleic imaging using optimized NIFS hydrogel. The bottom left inset represents the pre-expansion image. The magnified views of the box marked areas (pre- and post-expansion images) and the corresponding profiles in (L) are shown in (M) and (N). All scales are converted to pre-expansion dimension.

