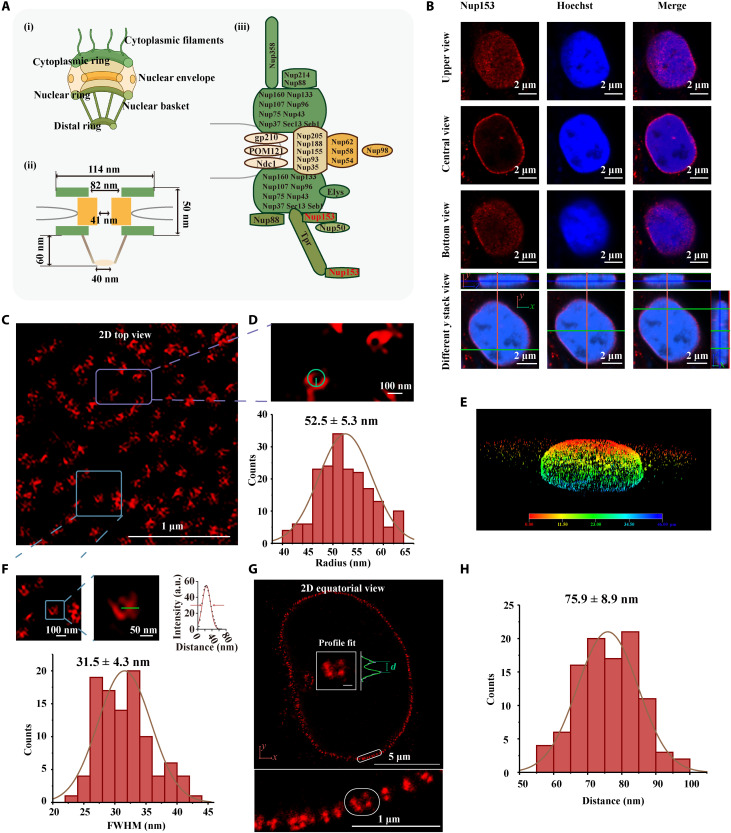
Fig. 4. NPC images in ExM with NIFS hydrogel.
(A) (i) Overall structure of NPC, (ii) size distribution of the NPC structure, and (iii) distribution of antigens in the NPC structure. (B) Pre-expansion images of Nup153. The top and bottom views indicate that Nup153 is parallel to the nucleus. The center view shows Nup153 display around the nucleus. The different y positions cross-verify Nup153 display around the nucleus. (C) The post-expansion images illustrate the landscape spatial distribution of Nup153 (2D top view). (D) Magnified views of the purple box marked area in (C) and radius evaluation method in the individual ring of Nup153. The histogram is the radius distribution of Nup153 (n = 150 from three replicates; each replicate chooses one region). (E) 3D image of Nup153 in post-expansion confocal image. (F) Magnified views of the blue box marked area in (C) and FWHM evaluation method in the individual ring of Nup153. The histogram of FWHM distribution (n = 100 from three replicates; each replicate chooses one region). (G) 2D equatorial view of Nup153 image. The bottom is the enlarged view of the white boxed area in top images. The inside profile fit of the top image is the Nup153 ring distance analysis method. Scale bar, 100 nm. (H) Histogram of the separated Nup153 ring distance (n = 100 from three replicates; each replicate chooses one region). All scales are converted to pre-expansion dimensions.

