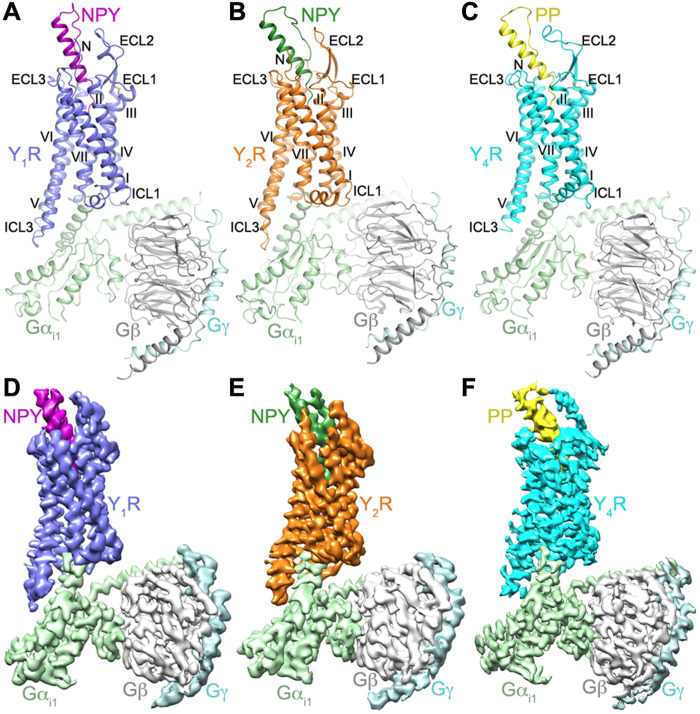
Fig. 1. Structures and cryo-EM maps of NPY/PP-YR-Gi1 complexes.
(A) Structure of the NPY-Y1R-Gi1 complex. Y1R, NPY, Gαi1, Gβ, and Gγ are colored blue, purple, light green, gray, and light cyan, respectively. (B) Structure of the NPY-Y2R-Gi1 complex. Y2R, NPY, Gαi1, Gβ, and Gγ are colored orange, green, light green, gray, and light cyan, respectively. (C) Structure of the PP-Y4R-Gi1 complex. Y4R, PP, Gαi1, Gβ, and Gγ are colored cyan, yellow, light green, gray, and light cyan, respectively. The structures are shown in cartoon representation. The disulfide bonds are shown as yellow sticks. (D to F) Cryo-EM maps of the NPY/PP-YR-Gi1 structures, colored according to chains. (D) NPY-Y1R-Gi1; (E) NPY-Y2R-Gi1; (F) PP-Y4R-Gi1.

