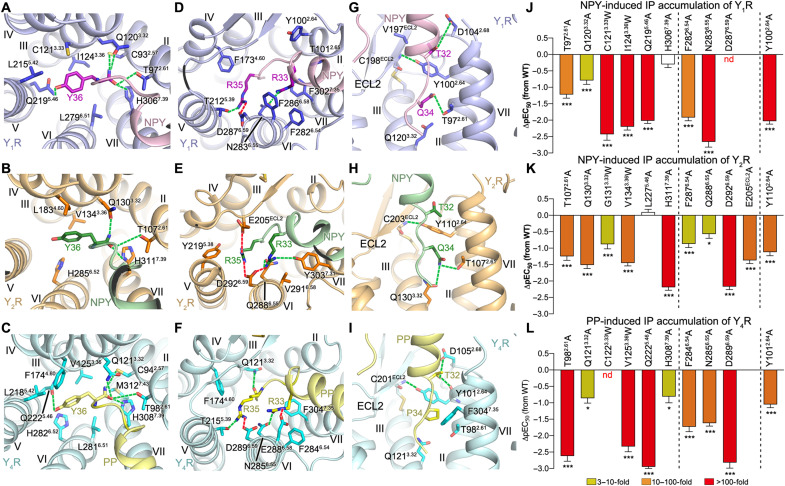
Fig. 5. Receptor-specific interactions between YR and the C terminus of the NPY peptide.
(A to C) Interactions between YR and the peptide residue Y36. (D to F) Interactions between YR and the peptide residues R33 and R35. (G to I) Interactions between YR and the peptide residues T32 and Q/P34. The salt bridges and hydrogen bonds are displayed as red and green dashed lines, respectively. (A, D, and G) NPY-Y1R-Gi1; (B, E, and H) NPY-Y2R-Gi1; (C, F, and I) PP-Y4R-Gi1. (J to L) NPY/PP-induced IP accumulation of YRs. (J) Y1R mutants; (K) Y2R mutants; (L) Y4R mutants. Bars represent differences in calculated peptide potency (pEC50) for each mutant relative to the WT receptor. Data are means ± SEM from at least three independent experiments performed in technical triplicate. *P < 0.01; ***P < 0.0001 by one-way analysis of variance followed by Dunnett’s post-test, compared with the response of the WT receptor. See table S1 for detailed statistical evaluation and expression level. The mutants are divided into three groups using two dashed lines: left, mutants for the residues that interact with Y36 of NPY/PP; middle, mutants for the residues that interact with R33 and R35 of NPY/PP; right, mutant for the residue Y2.64 that interacts with T32 of NPY/PP.

