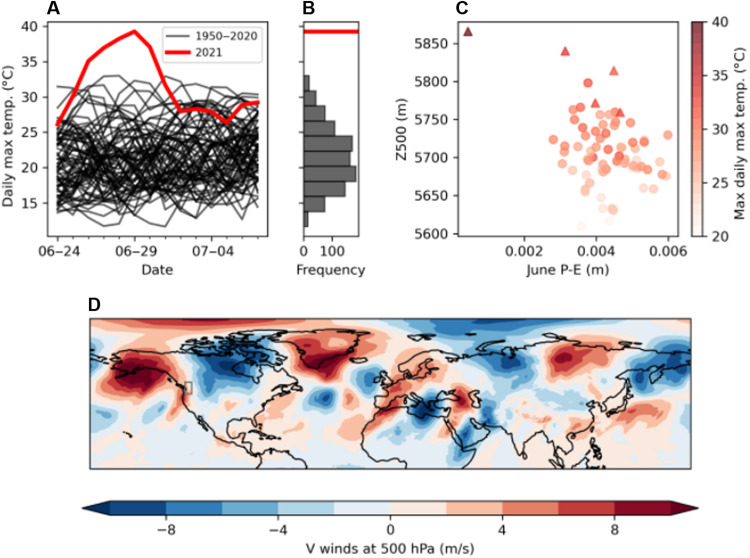
Fig. 1. The meteorology of the western North America 2021 heat extreme.
The synoptic pattern and statistics of the heat wave in the western North America for the last week of June and first week of July. (A) Time series plot of observed daily maximum temperatures for the last week of June and first week of July in the region 45°N to 52°N, 119°W to 123°W, from 1950 to present. The time series for individual years in 1950–2020 are shown in black, whereas that for 2021 is shown in red. (B) Distribution of the 1950–2020 temperatures shown in (A). The red line shows the highest maximum temperature in 2021, which happened on 29 June. (C) Scatter plot of geopotential height at 500 hPa (Z500) over the 2-week period 24 June to 7 July versus precipitation minus evaporation (P-E) over June, with both axes showing values averaged over the area of interest. Each dot represents 1 year between 1950 and 2021. The color of the dots indicates the maximum area–averaged daily maximum temperature over the corresponding 2-week period. Triangles indicate the five hottest events, with the triangle in the darkest red color indicating the 2021 event. (D) Northward component of wind at 500 hPa in the Northern Hemisphere, averaged over the same 2-week period in 2021; gray box over western North America indicates the region assessed: 45°N to 52°N, 119°W to 123°W.

