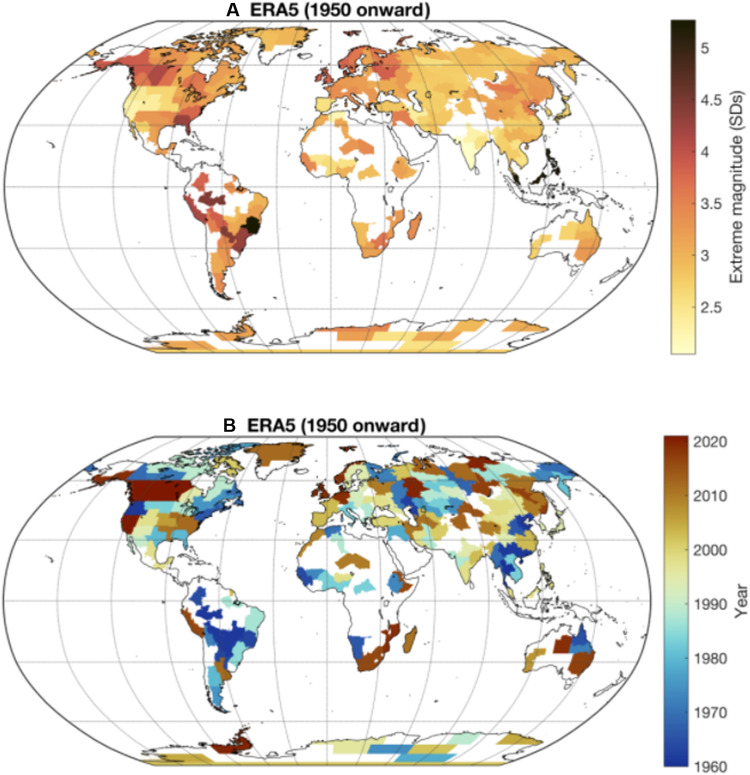
Fig. 3. Global map of the most extreme observed heat extremes relative to the climate of that period.
Data are taken from ERA5, January 1950 to August 2021. The values are expressed in terms of how many SDs away from the mean temperature the most extreme heat day was, assessed against a moving climatology so that the climate change signal is excluded (see Materials and Methods). The regions are taken from Stone, 2019 (35). (A) SD away from the mean of the greatest historic extreme in each region. (B) Year in which the greatest historic extreme occurred. Regions where there is poor agreement between ERA5 and JRA55 reanalyses are excluded.

