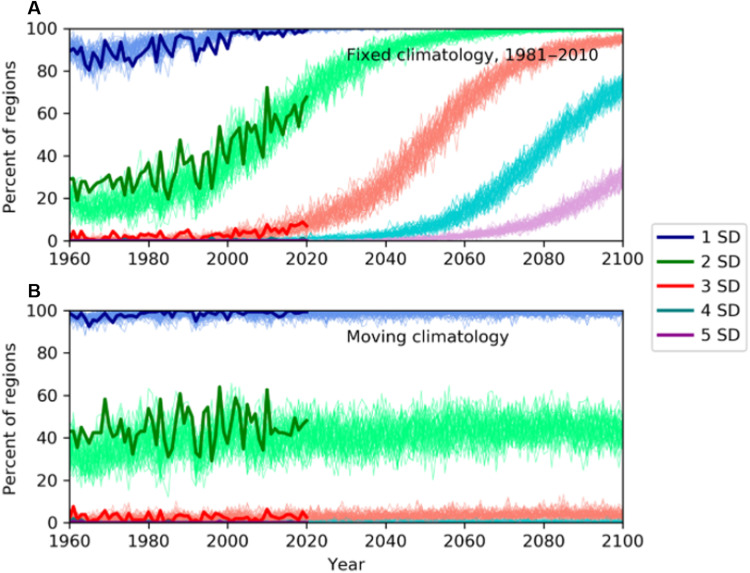
Fig. 4. Historical and projected changes to temperature extremes.
(A) Percentage of regions around the globe experiencing events each year above the specified thresholds of 1 to 5 SDs above the mean, calculated against the 1981–2010 historical baseline climatology for ERA5 (bold lines) and 50 ensemble members of the CanESM5, SSP585 (multiple thinner lines). (B) Same as (A), but calculated against a moving climatology of the decade before the year assessed to account for the climate change signal. As with Fig. 3, regions with poor agreement between ERA5 and JRA55 have been excluded in both ERA5 and CanESM5.

