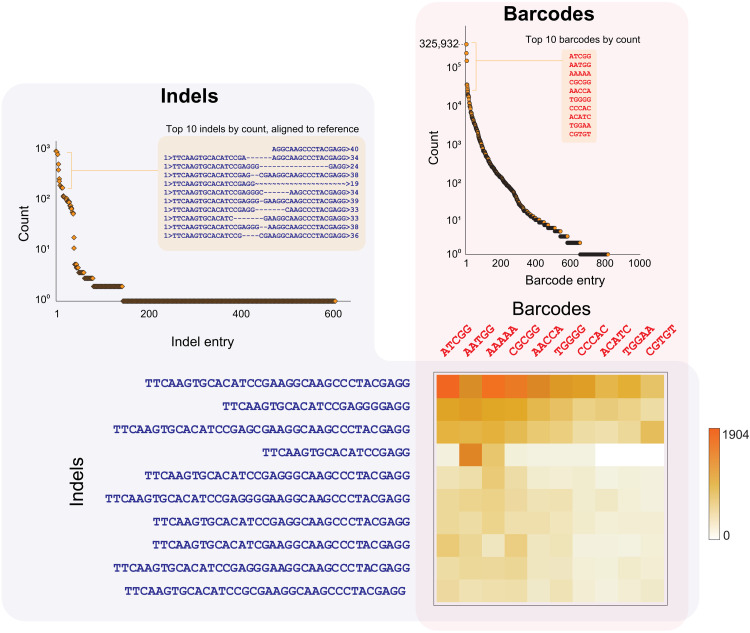
Fig. 3. Distribution of indels and barcodes that makeup a CRISPR-PUF.
(Right) Frequency of detected barcodes. In total, 805 unique barcodes were observed. (Left) Frequency of detected indels. In total, 569 unique indels were observed. (Bottom) Barcode/indel matrix. Heatmap presentation of the pilot CRISPR-PUF matrix consisting of the 10 most frequently occurring barcodes and indels. The color of each tile in the heatmap indicates the number of cells with the corresponding combination of indel and barcode.

