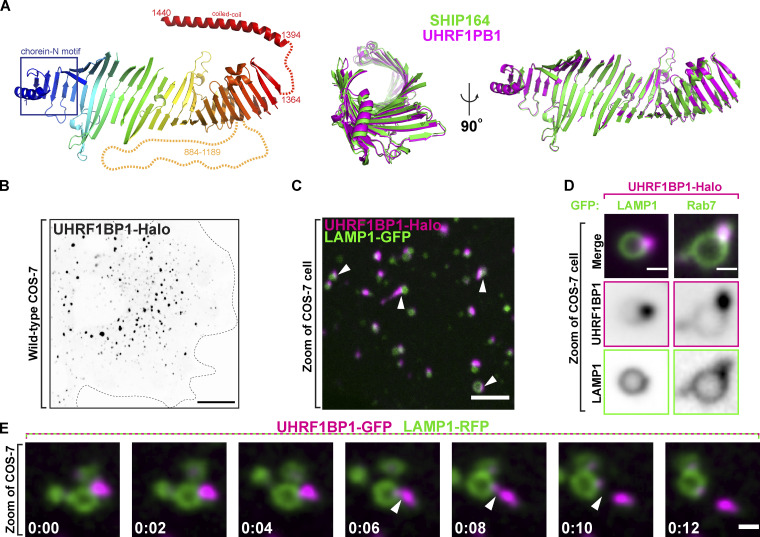
Figure 8.
The SHIP164 paralog UHRF1BP1 localizes on later endosomal compartments relative to SHIP164. (A) Left: The strucutre of UHRF1BP1 as predicted by the fold prediction algorithm AlphaFold. Middle and Right: Alignment of the core channel structures of SHIP164 (green) and UHRF1BP1 (purple) in two different orientations showing structural similarity. (B) Live fluorescence (inverted grays) image of a COS-7 cell expressing exogenous UHRF1BP1-Halo. Scale bar, 20 µm. (C) Live image of the cytoplasm of a COS-7 cell expressing exogenous UHRF1BP1-Halo (magenta) and the endolysosomal marker LAMP1-GFP (green). Arrowheads indicate SHIP164 accumulation juxtaposed to LAMP1-positive organelles. Scale bar, 5 µm. (D) High-magnification live fluorescence images of COS-7 cell expressing exogenous UHRF1BP1-Halo (magenta) and either LAMP1 or Rab7 (green). The individual channels are shown as inverted grays. Scale bar, 2 µm. (E) Time-series of live fluorescence images of exogenous UHRF1BP1-GFP (magenta) and LAMP1-RFP (green). Arrowheads point to a UHRF1BP1 accumulation undergoing fission. Time, seconds. Scale bar, 1 µm.

