Figure 7.
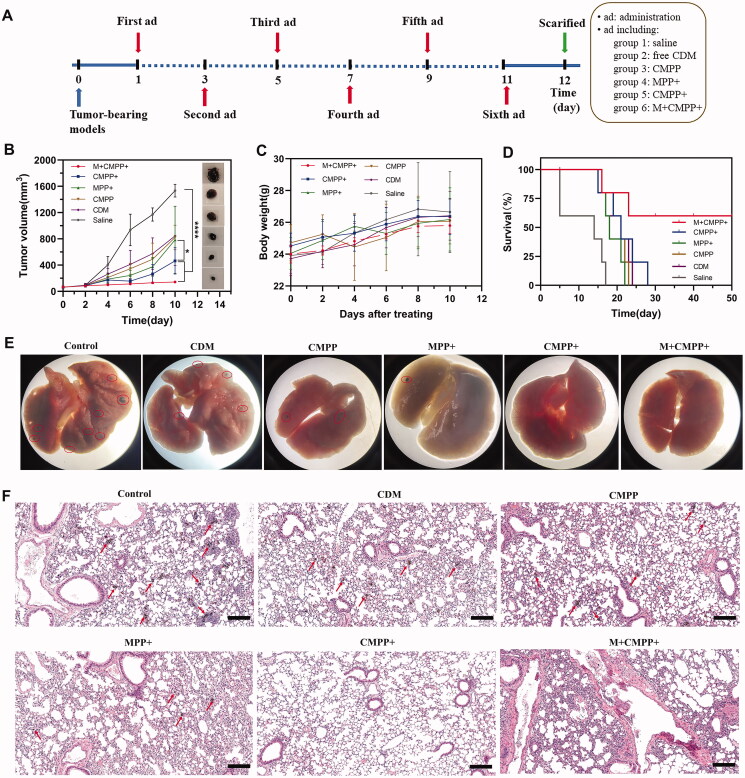
In vivo antitumor studies of CMPP. (A) Illustration of time schedule in vivo; (B) Tumor growth curve of mice with different treatment and representative images; (C) body weight changes with time; (D) morbidity free survival curves; (E) the photographs of lung tissues with the first dead mice bearing B16-F10 melanoma in each group after treatment; (F) H&E staining of the lung sections from the first dead mice bearing B16-F10 melanoma in each group after treatment. Scar bar: 200 μm, the red circles, and arrows represented melanoma.

