
. 2022 Feb 26;20(2):100–104. doi: 10.1080/2090598X.2021.2007464
© 2022 The Author(s). Published by Informa UK Limited, trading as Taylor & Francis Group.
This is an Open Access article distributed under the terms of the Creative Commons Attribution License (http://creativecommons.org/licenses/by/4.0/), which permits unrestricted use, distribution, and reproduction in any medium, provided the original work is properly cited.
Figure 1.
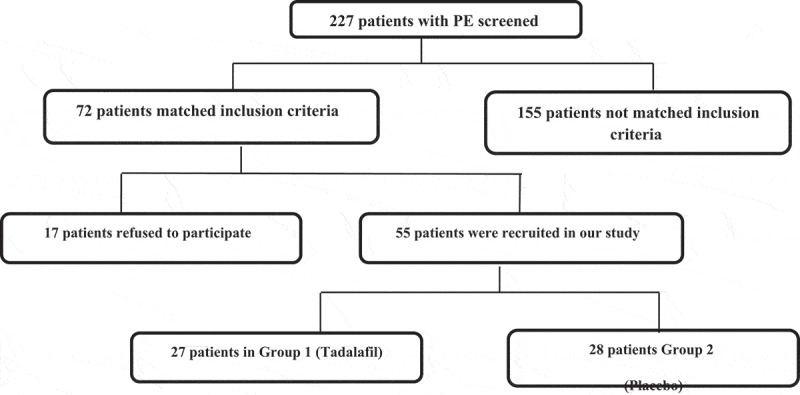
Flow chart of the patients included in the study.