Figure 1.
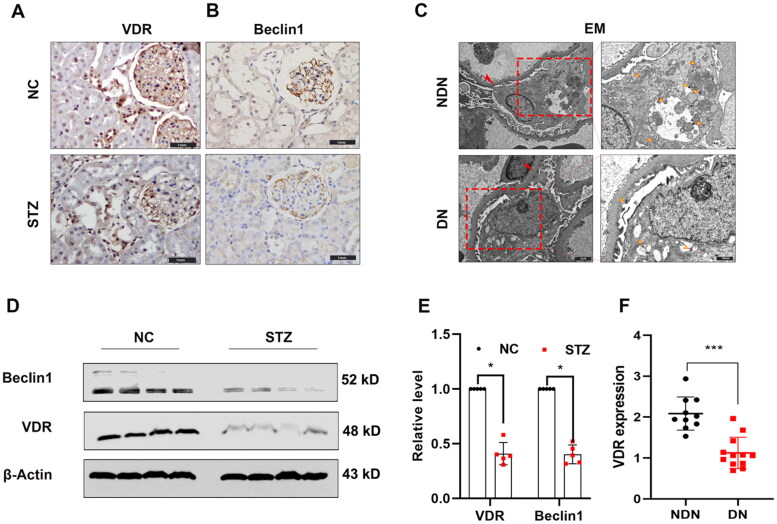
The expression of VDR protein and autophagosomes is down-regulated in diabetic kidneys. (A) The VDR level was detected by immunohistochemical staining (×400). (B) Representative pictures of anti-beclin1 immunohistochemical staining (×400). (C) Kidney biopsy specimens were from patients with diabetic nephropathy (DN) and non-tumor renal tissue from patients with kidney cancer. Representative ultrastructural imagines showing the double-membraned vesicles (autophagosomes) in podocytes. Basement membrane (red arrows) and autophagosomes (yellow arrow). (D) Western blot analysis of VDR and Beclin1 in the renal cortex of rats from each group as indicated. (E) Relative expression of proteins levels. (F) The VDR levels in patients with diabetic nephropathy (DN) and non-tumor renal tissue from patients with kidney cancer were measured by ELISA. Data were presented as mean ± SD. ***p < 0.001.

