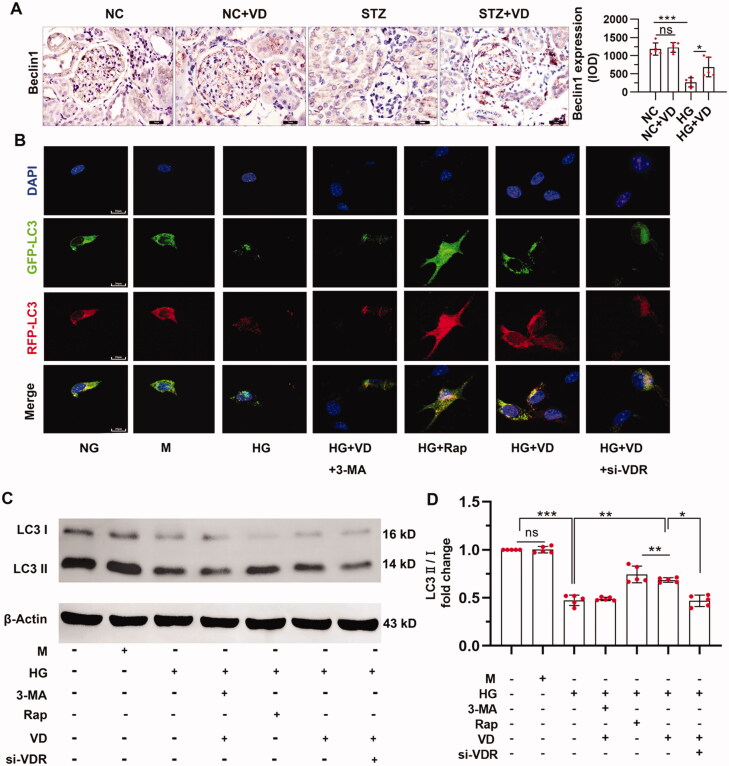
Figure 3.
Effect of aVitD3 treatment on autophagy in vivo and vitro. (A) Representative images and quantitative analysis of immunohistochemical staining for beclin1 (×400). SD male rats were intraperitoneally injected with 60 mg/kg streptozotocin. After 3 days, the rats with STZ treatment were garaged with 0.1μg/kg/d calcitriol or vehicle solution daily for consecutive 18 weeks. Kidney tissues were collected for immunohistochemical staining (B) Immunofluorescence analysis of LC3 puncta in MPC-5 cells of each group as indicated. Representative images of GFP-LC3 and RFP-LC3 fluorescence staining (×630). Scale bar: 20 µm. (C) Western blot analysis of LC3 in MPC-5 cells from each group as indicated. (D) Relative expression of proteins levels. Band densities were measured by the ImageJ program. The ratio of protein/actin density was calculated and normalized with the sham controls. Data were presented as mean ± SD. n = 5. *p < 0.05, **p < 0.01, ***p < 0.01.

