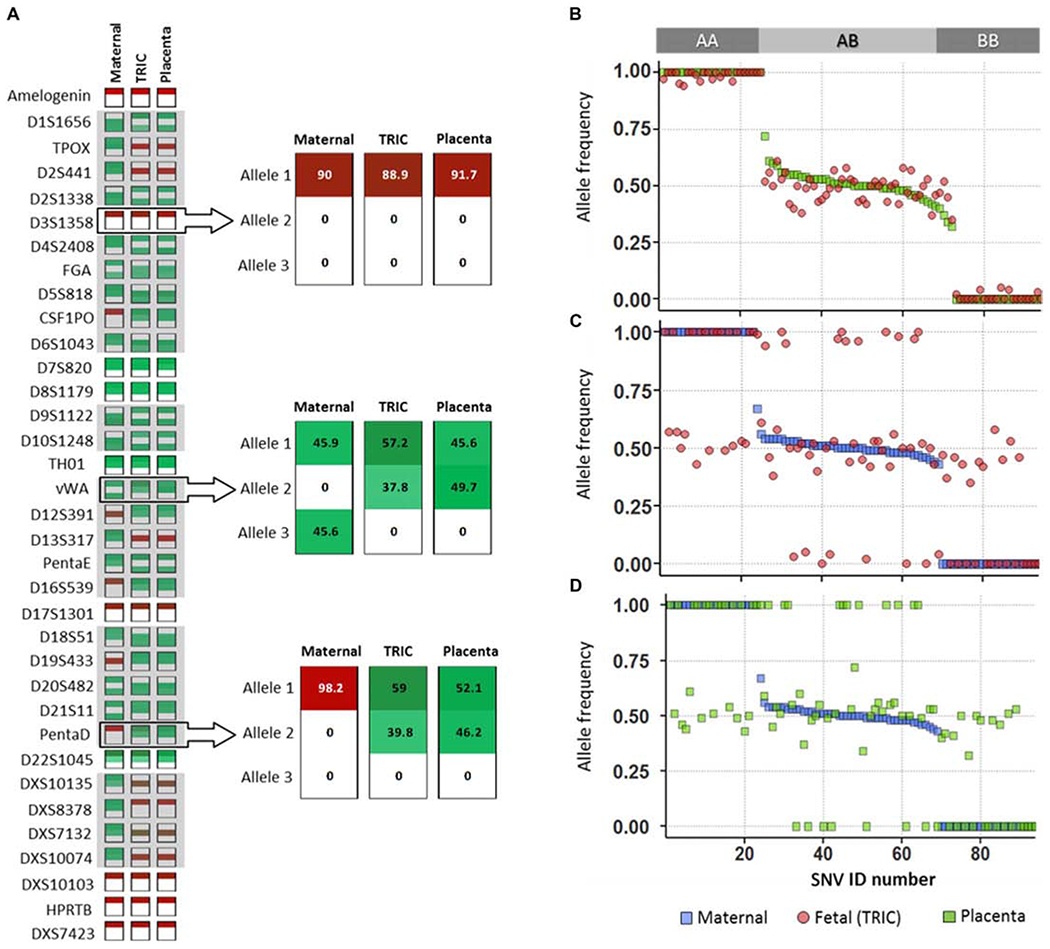
Fig. 2. Targeted sequencing of fetal trophoblast cells obtained by TRIC.

(A) Graphical representation of STR profiles of DNA triads composed of maternal cells (Maternal), fetal trophoblast cells (TRIC), and placental tissue (Placenta) from sample SN (Table 1). For eachDNA sample, the two dominant alleles with the highest relative peaks (green), or single peak when homozygous (red), were determined for each STR and compared among the triad. The adjacent miniplots show distribution of shared STRs (upper miniplot) and discriminatory STRs (middle and lower miniplots) with the percentage of reads indicated numerically and by color intensity for each dominant allele. (B to D) Comparisons of allelic frequencies for the 94 sequenced SNVs in sample SD (Table 1). (B) Fetal trophoblast and maternal cells, (C) fetal trophoblast cells and placenta, and (D) maternal cells and placenta.
