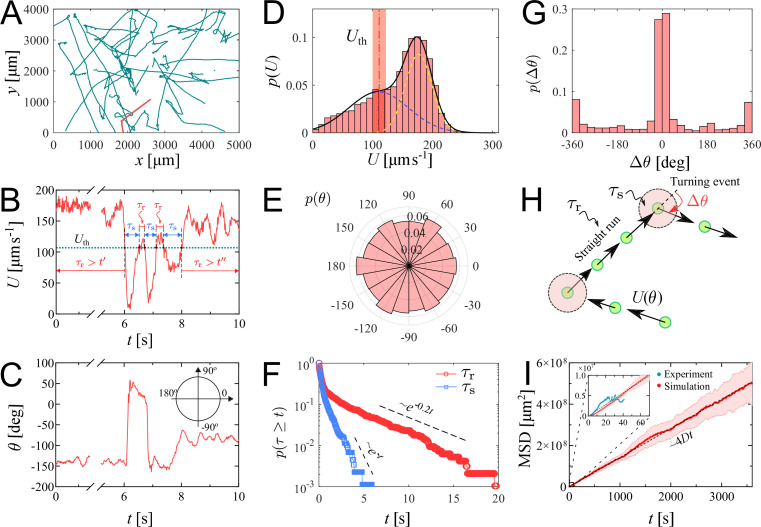
Figure 2. Swimming trajectories of P. parasitica zoospores.
(A) Trajectories of zoospores swimming in water captured from the microscopic assay for 60 s. Sample size . Note: not all trajectories are shown. Each position of the zoospores is captured every . The trajectories are smoothed with moving average (step length ). (B) The progression of speed and (C) moving directions θ over time of a single zoospore extracted from the population in the assay. (D) Distribution of zoospore speed . (E) Polarity distribution of moving direction . (F) Survival curves of the running time and stopping time . (G) Distribution of turning angle , with positive angle values indicating counter-clockwise, and negative as clockwise direction. (H) Schematics showing the strategy of the simulation model of zoospores swimming in water. (I) The estimated mean squared displacement (MSD) over time intervals , constructed from the simulation data. The inset compares the experimental data and simulation of MSD at the experimental time-scale of 60 s. By simulation, at long time scale of 1 h, MSD of zoospores shows a diffusion of Brownian particles with the diffusion coefficient .

