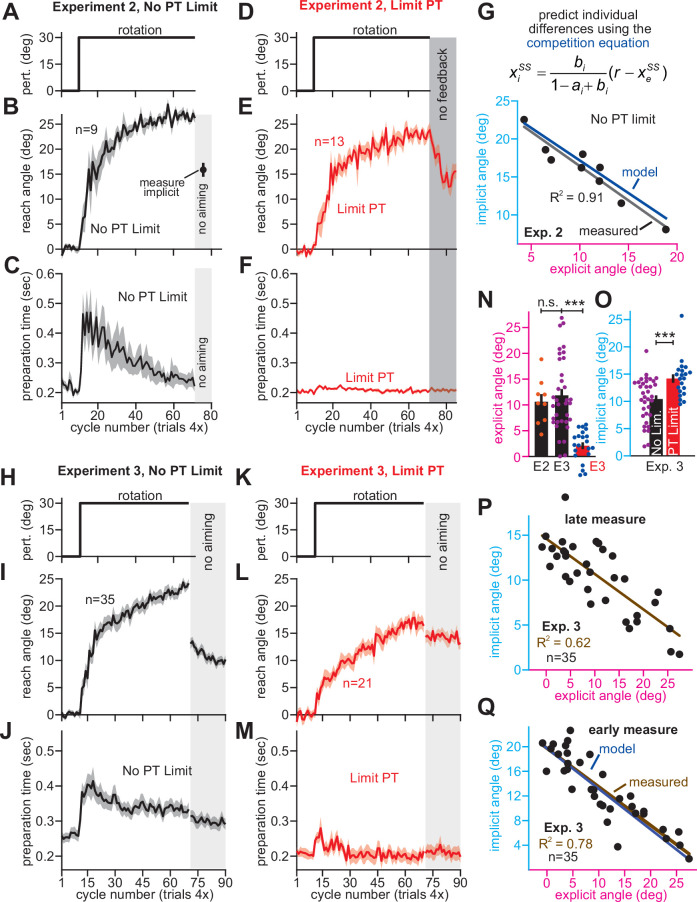
Figure 3. Strategy suppresses implicit learning across individual participants.
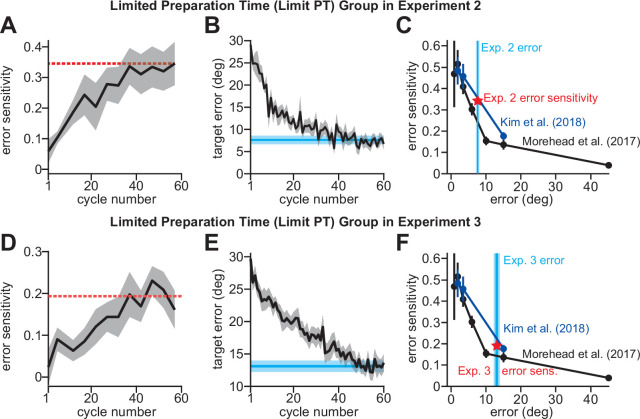
(A–C) In Experiment 2, participants in the No PT Limit (no preparation time limit) group adapted to a 30° rotation. The paradigm is shown in A. The learning curve is shown in B. Implicit learning was measured via exclusion trials (no aiming). Preparation time is shown in C (movement start minus target onset). (D–F) Same as in A–C, but in a limited preparation time condition (Limit PT). Participants in the Limit PT group had to execute movements with restricted preparation time (F). The task ended with a prolonged no visual feedback period where memory retention was measured (E, gray region). (G) Total implicit and explicit adaptation in each participant in the No PT Limit condition (points). Implicit learning measured during the terminal no aiming probe. Explicit learning represents difference between total adaptation (last 10 rotation cycles) and implicit probe. The black line shows a linear regression. The blue line shows the theoretical relationship predicted by the competition equation which assumes implicit system adapts to target error. The parameters for this model prediction (implicit error sensitivity and retention) were measured in the Limit PT group. (H–J) In Experiment 3, participants adapted to a 30° rotation using a personal computer in the No PT Limit condition. The paradigm is shown in H. The learning curve is shown in I. Implicit learning was measured at the end of adaptation over a 20-cycle period where participants were instructed to reach straight to the target without aiming and without feedback (no aiming seen in I). We measured explicit adaptation as difference between total adaptation and reach angle on first no aiming cycle. We measured ‘early’ implicit aftereffect as reach angle on first no aiming cycle. We measured ‘late’ implicit aftereffect as mean reach angle over last 15 no aiming cycles. (K–M) Same as in H–J, but for a Limit PT condition. (N) Explicit adaptation measured in the No PT Limit condition in Experiment 2 (E2), No PT Limit condition in Experiment (E3, black), and Limit PT condition in Experiment 3 (E3, red). (O) Late implicit learning in the Experiment 3 No PT Limit group (No Lim.) and Experiment 3 Limit PT group (PT Limit). (P) Correspondence between late implicit learning and explicit strategy in the Experiment 3 No PT Limit group. (Q) Same as in G but where model parameters are obtained from the Limit PT group in Experiment 3, and points represent subjects in the No PT Limit group in Experiment 3. Early implicit learning is used. Throughout all insets, error bars indicate mean ± SEM across participants. Statistics in N and O are two-sample t-tests: n.s. means p > 0.05, ***p < 0.001.


