. 2022 Feb 28;11:e65361. doi: 10.7554/eLife.65361

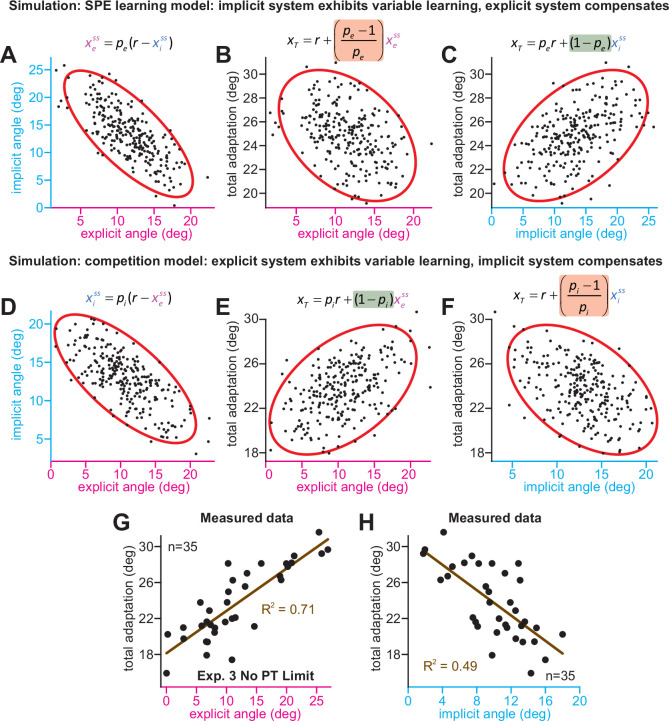
Figure 5. Implicit-explicit correlations with total adaptation match the competition theory.

The competition equation states that xiss = pi(r – xess), where pi is a scalar learning gain depending on ai and bi. The competition between steady-state implicit (xiss) and explicit (xess) adaptation predicted by this model is simulated in D across 250 hypothetical participants. The model pi is fit to data in Experiment 3. Total learning is given by xTss = xiss + xess. These two equations can be used to derive expressions relating total learning (xTss) to steady-state implicit (xiss) and explicit (xess) learning. In E, we show that the competition theory predicts a positive relationship between explicit learning and total adaptation (equation at top derived in Appendix 7, green denotes a positive gain). In F, we show that the competition theory predicts a negative relationship between implicit learning and total adaptation (equation at top derived in Appendix 7, red shading denotes negative gain). In (A–C), we consider an alternative model. Suppose that implicit learning is immune to explicit strategy and varies independently across participants. This is equivalent to the SPE learning model. But in this case, the explicit system could respond to variability in implicit learning via another competition equation: xess = pe(r – xiss). Here, pe is an explicit learning gain (must be less than one to yield a stable system). In A, we show the negative relationship between implicit and explicit adaptation predicted by this alternate SPE learning model. In B, we show that when the explicit system responds to implicit variability (SPE learning) there is a negative relationship between total adaptation and explicit strategy. The equation at top is derived in Appendix 7. In C, we show that the SPE learning model will yield a positive relationship between implicit learning and total adaptation. Equation at top derived in Appendix 7. (G) We measured the relationship between explicit strategy and total adaptation in Exp. 3 (No PT Limit group). Total learning exhibits a positive correlation with explicit strategy. (H) Same concept as in G, but here we show the relationship between total learning and implicit adaptation. The patterns in G and H are consistent with the competition theory (compare with E and F).

Figure 5—source code 1. Figure 5 data and analysis code.

Figure 5.

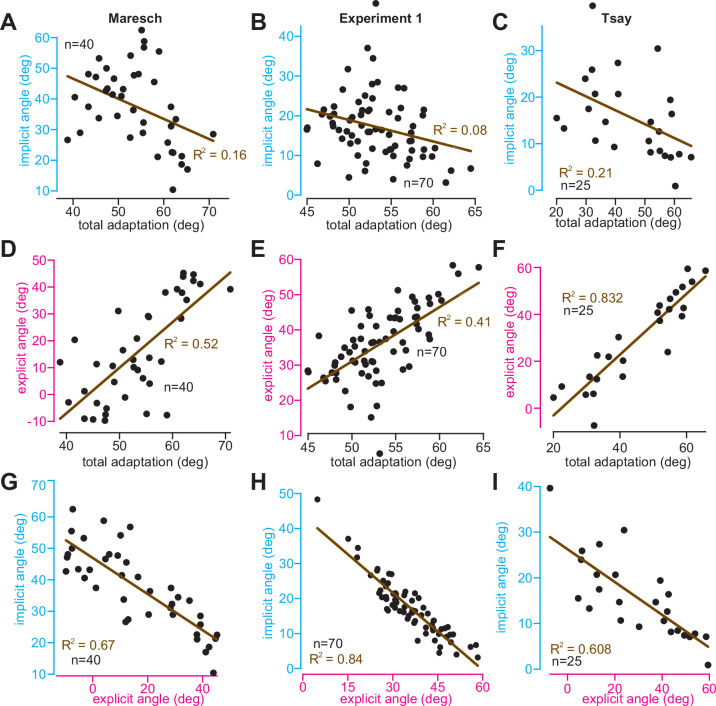
Figure 5—figure supplement 1. Relationships between implicit, explicit, and total learning indicate competition.

Figure 5—figure supplement 1.

Data were analyzed across three experiments. In the left column, we report participants in the CR, IR-E, and IR-EI groups in Maresch et al., 2021 In the middle column, we report participants collapsed across the abrupt and stepwise 60° rotation period in Experiment 1. In the right column, we report participants in the 60° rotation group in Tsay et al., 2021a. In each experiment, we analyzed implicit learning, explicit learning, and total adaptation. Implicit and explicit learning were estimated with exclusion (‘no aiming’) trials. (A–C) The relationship between implicit learning and total adaptation. (D–F) The relationship between explicit learning and total adaptation. (G–I) Relationship between implicit and explicit learning. All lines in A–I denote a linear regression. The associated R2 statistic is shown in each inset. All relationships were statistically significant (p < 0.05). Dots in each inset denote individual participants.
Figure 5—figure supplement 1—source code 1. Figure 5—figure supplement 1 data and analysis code.
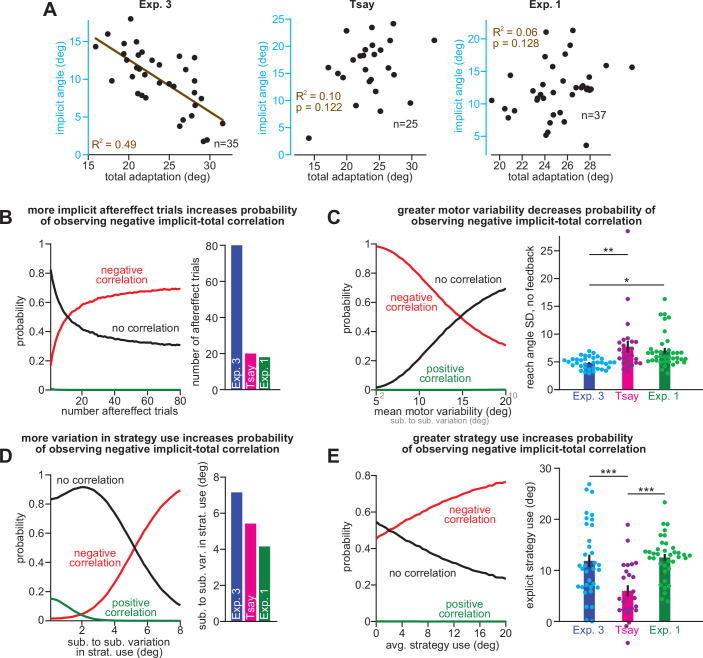
Figure 5—figure supplement 2. Factors that weaken the correlation between implicit learning and total adaptation.

Figure 5—figure supplement 2.

(A) At left, we reproduce the relationship between implicit learning and total adaptation in the No PT Limit group in Experiment 3. In the middle inset, the same analysis is shown for participants in the 30° group in Tsay et al., 2021a. At right, the same analysis is shown for participants in the stepwise 30° rotation period in Experiment 1. Relationships between implicit learning and total adaptation were not statistically significant (p > 0.05) at middle and right. In B–E we explore factors that can weaken the relationship between implicit learning and total adaptation in the competition theory. The four factors are: B, total number of aftereffect trials used to measure implicit learning, (C), motor variability in the reach, (D), between-subject variability in strategy use, and E, total strategy use in the subject population. At left in each inset we conducted a power analysis. In this power analysis, n = 30 participants were simulated. Explicit strategies were randomly sampled. Implicit learning was then obtained via the competition equation. Implicit, explicit, and total learning were calculated for each simulated participant, by averaging over a set number of trials. Simulations were repeated 40,000 times. The probability that a negative relationship (red line), positive relationship (green line), and no relationship (black line) occurred is shown in the left inset. In B, at left, we show that with fewer trials to measure implicit learning, the probability that an experiment will yield a statistically significant relationship between implicit learning and total adaptation decreases substantially. At right, we compare the total number of “no aiming” trials used to measure implicit learning in Exp. 3, Tsay et al., and Exp. 1 (stepwise). In C, at left, we show that increases in trial-to-trial reach variability (i.e. motor execution noise) dramatically reduce the probability than an experiment will produce a statistically significant relationship between implicit learning and total adaptation. At right, we analyze trial-to-trial variability during the no aiming period in each experiment. In D, at left, we show that little variability in strategy use across participants reduces the probability that an experiment will yield a negative relationship between implicit learning and total adaptation. At right, we show the standard deviation in explicit strategies across subjects in the three experiments. In (E), at left, we show that little overall strategy use in the subject population decreases the probability that an experiment will yield a negative relationship between implicit learning and total adaptation. At right, we compare explicit strategies across the three experiments. Statistics in C and E denote a one-way ANOVA.
Figure 5—figure supplement 2—source code 1. Figure 5—figure supplement 2 data and analysis code.
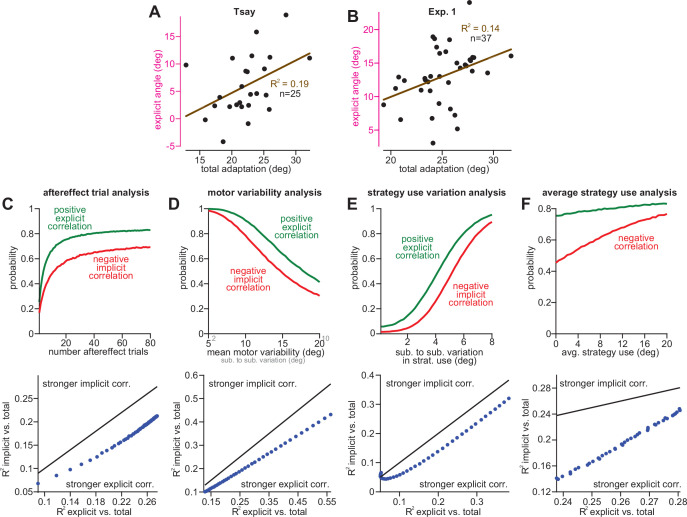
Figure 5—figure supplement 3. Correlations between explicit learning and total adaptation are more robust to between-subject implicit variability.

Figure 5—figure supplement 3.

(A) Here, we show the correlation between explicit strategy and total adaptation in the 30° rotation group in Tsay et al., 2021a. (B) Same as A, but for the stepwise 30° rotation period in Experiment 1. In C–F, we show implicit and explicit correlations with total adaptation can be weakened by four factors: (C), total number of aftereffect trials used to measure implicit and explicit learning, (D), motor variability in the reach, (E), between-subject variability in strategy use, and (F), total strategy use in the subject population. At left in each inset we conducted a power analysis. In this power analysis, n = 30 participants were simulated. Explicit strategies were randomly sampled. Implicit learning was then obtained via the competition equation. Implicit, explicit, and total learning were calculated for each simulated participant, by averaging over a set number of trials. Simulations were repeated 40,000 times. At top we show the probability over these iterations that a statistically significant positive relationship between explicit strategy and total adaptation (green lines) and negative relationship between implicit learning and total adaptation (red lines) occur. At bottom, we calculated the average R2 value for the implicit-total and explicit-total regressions. Each point compares the two R2 values for each simulation condition above, with the unity line (black). In C, we show that more aftereffect trials improves the probability of obtaining statistically significant correlations, but the explicit-total correlation is stronger than the implicit-total correlation. In D, we show that less motor variability improves the probability of obtaining statistically significant correlations, but the explicit-total correlation is stronger than the implicit-total correlation. In E, we show that greater subject-to-subject variability in strategy improves the probability of obtaining statistically significant correlations, but the explicit-total correlation is stronger than the implicit-total correlation. In F, we show that greater overall strategy improves the probability of obtaining statistically significant correlations, but the explicit-total correlation is stronger than the implicit-total correlation.
Figure 5—figure supplement 3—source code 1. Figure 5—figure supplement 3 data and analysis code.
Figure 5—figure supplement 4. Variance in implicit learning properties weakens the relationship between implicit learning and total adaptation in the competition theory.
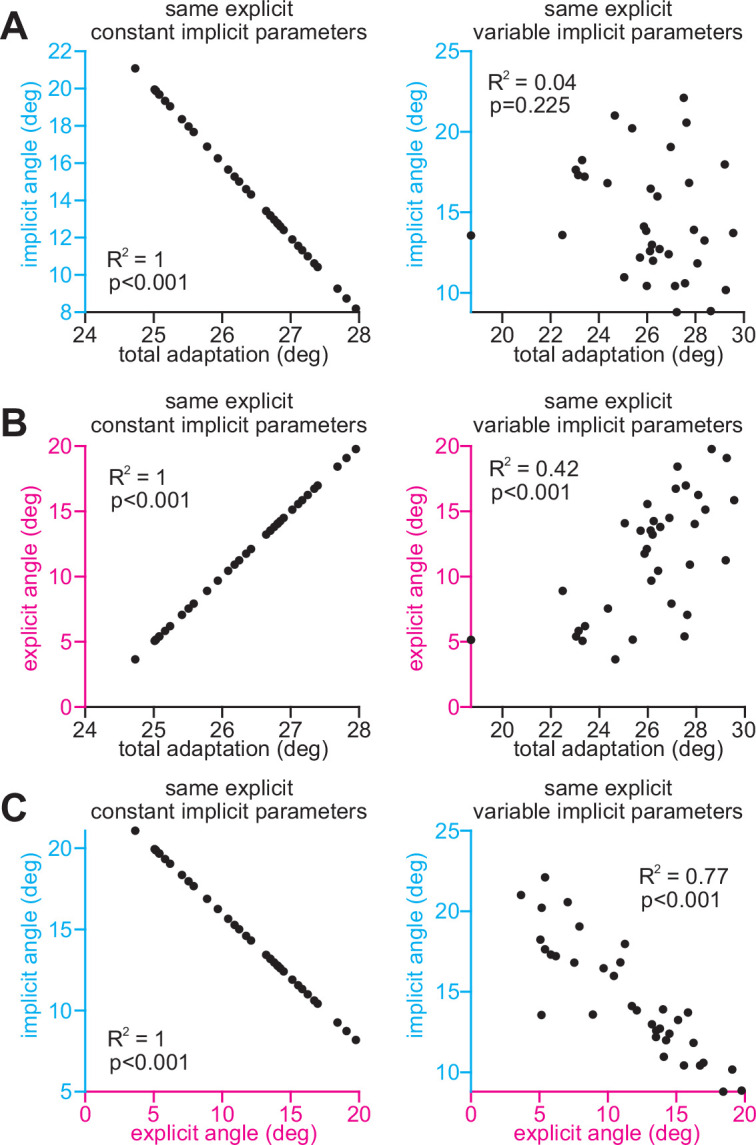
Figure 5—figure supplement 4.

Here, we consider two sources of variability: (1) subject-to-subject variability in explicit strategy, and (2) subject-to-subject variability in implicit learning. We simulate explicit strategies across 35 participants. The explicit strategies are the same in the left column (same explicit) and the right column (same explicit). They are sampled from a normal distribution: mean = 12°, SD = 4°. However, the left and right columns differ in terms of implicit variability. In the left column, there is no implicit variability across subjects. Implicit learning was calculated using the competition theory, using the same implicit learning gain (pi = 0.8). In the right column, we added variability to this implicit learning gain. This represents the more realistic scenario, that implicit retention and error sensitivity vary across participants. The implicit learning gain was randomly sampled with a normal distribution, mean = 0.8, SD = 0.1. In A, we show the relationship between implicit learning and total adaptation in these toy cases. In B, we show the relationship between explicit learning and total adaptation in these toy cases. In C, we show the relationship between implicit learning and explicit learning in these toy cases. Note that the relationship between implicit learning and total adaptation (A, at right) was uniquely susceptible to variability (p = 0.225), whereas other correlations remained strong and statistically significant (B and C, at right).
Figure 5—figure supplement 4—source code 1. Figure 5—figure supplement 4 analysis code.