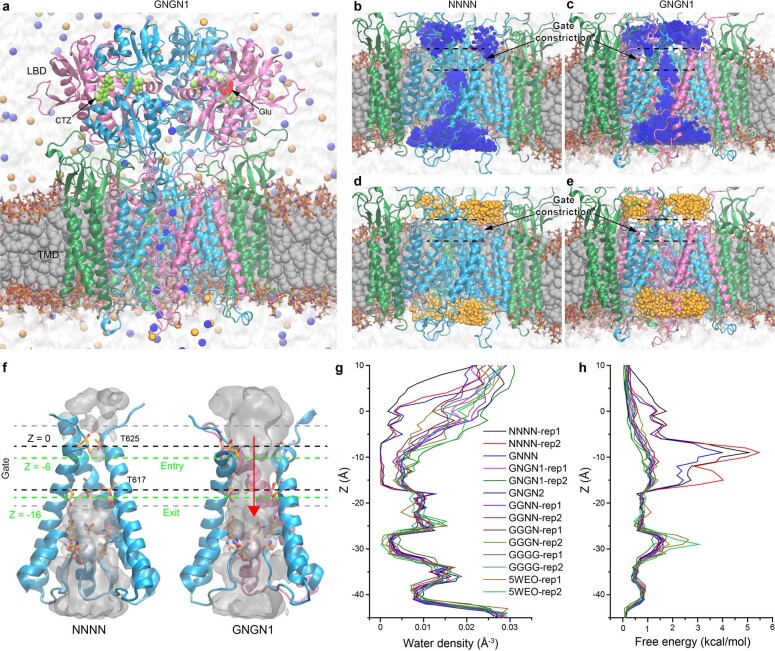
Extended Data Fig. 5. MD simulation system, ion conductance and water density.
a, A snapshot of the simulated GNGN1 system with AMPA receptor and γ2 subunits shown as blue, pink and green ribbons, lipid bilayer in grey space-filling representation with hydrophilic head groups as sticks, CTZ in pale green, glutamate in red, water as light grey continuum, and Na+ and Cl− ions as blue and orange spheres, respectively. b-e, MD simulation system for NNNN (b,d) and GNGN1 (c,e) with integral occupancy of the pore by Na+ (b-c) and Cl− (d-e) ions. f, Channel pore in NNNN (closed) and GNGN1 (open) structures with the integral occupancy by water shown as light grey continuum. Water permeation was calculated as the number of water molecules crossing the space between levels Z = –6 Å and Z = –16 Å (dashed green lines) per ns (red arrow). g, Water density profiles are shown for all simulated systems. The center of mass of four T625 residues is taken as the origin. h, Free energy for resident water to enter the channel. Continuous water occupancy, an indication of water conductance, is observed in all structures, except closed-state structures NNNN and GNNN, which remain non-conducting during microsecond-long simulations. Plots in g and h are aligned with the structure in (f).

