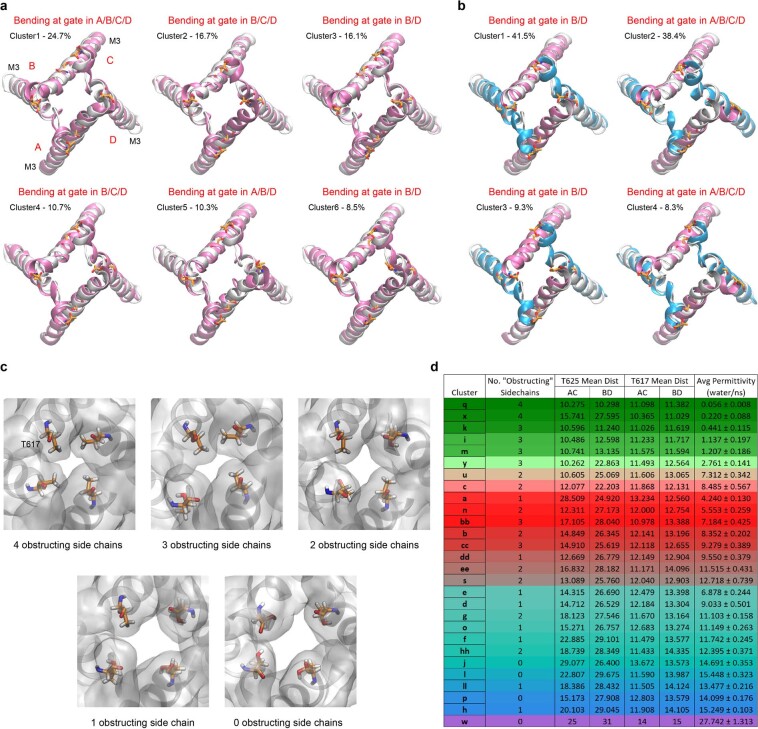
Extended Data Fig. 6. Conformational flexibility of simulated structures and cluster analysis of permeation.
a, Ensemble of structures (pink) simulated starting with 5WEO structure (grey) and sorted with the k-means clustering algorithm. Structure alignment was done using the backbone atoms C, O, N, Cα, Cβ for residues in the channel gate (S614 to T625) over the total of 16,112 MD frames. Unlike cryo-EM structure, cluster representatives suggest wider opening of the M3 gate with deformation and/or bending in A/C subunits along with bending in B/D subunits during the simulations. Only the first six out of the total of 10 clusters are shown, which represent more than 85% of population. b, Representative M3-aligned structures from RMSD clustering (using backbone atoms C, O, N, Cα, Cβ) of the M3 gate residues (S614 to T625) performed over the total of 12,493 frames from both replicas of GNGN1. For the reference, the M3 segments of the cryo-EM structure are shown in grey. The largest cluster, Cluster1, shows similar to the cryo-EM structure bending at B/D. The second largest cluster, Cluster2, which represents ~38% of the population, shows wider opening of the M3 gate, with deformation and/or bending in A/C subunits along with bending in B/D subunits during MD simulations. Only the first four out of five clusters are shown, which represents more than 95% population. c, Five conformational configurations of T617 determining permeation of water. d, Clusters listed in order of increasing water permeation, computed as a number of water molecules crossing the gate region in one direction per ns. Distances are in Angstroms.

