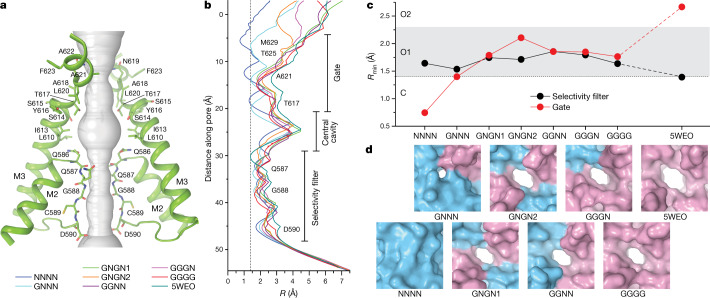
Fig. 3. Ion channel pore.
a, Pore-forming domains in GNGN1 with the residues that line the pore shown as sticks. Only two of four subunits are shown, with the front and back subunits omitted for clarity. The pore profile is shown as a space-filling model (grey). b, Pore radius values calculated using HOLE. The vertical dashed line denotes the radius of a water molecule (1.4 Å). c, Minimum pore radius values in the selectivity filter (black) and gate region (red). d, The gate region of the pore of the indicated structures in surface representation viewed perpendicular to the membrane.

