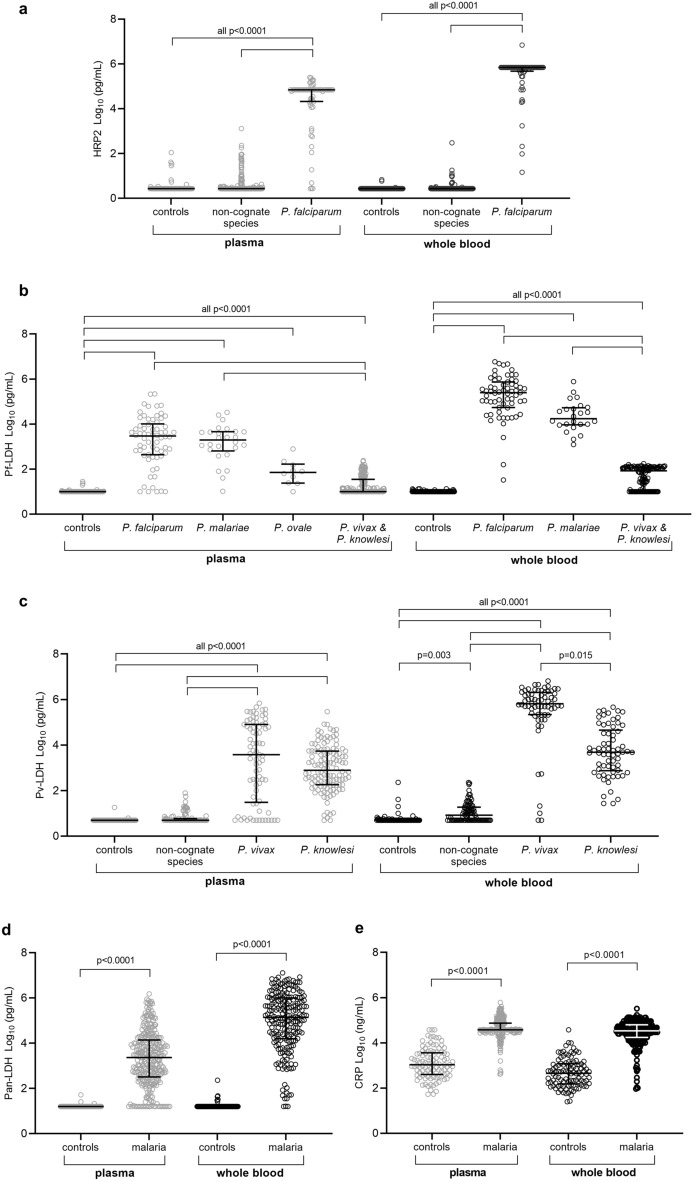
Figure 1.
Distribution of malaria antigen concentrations in malaria patients and controls. Scatter plots of the concentration of histidine-rich protein-2 (a), P. falciparum lactate dehydrogenase (Pf-LDH) (b), P. vivax LDH (Pv-LDH) (c), Pan Plasmodium LDH (Pan-LDH) (d) and C-reactive protein (CRP) (e) were determined in plasma and whole blood samples. Refer to Table 1 for sample sizes. Non-cognate species in A correspond to Pv, P. knowlesi (Pk), P. malariae (Pm) and P. ovale (Po; plasma only); and in C correspond to Pf, Pm and Po. Antigen concentrations were log transformed. Individual datapoints with median and interquartile-range shown. The Kruskal–Wallis test with Dunn’s multiple comparison was used in (a)–(c), and the Man-Whitney test in (d) and (e). A P-value < 0.05 was considered statistically significant.

