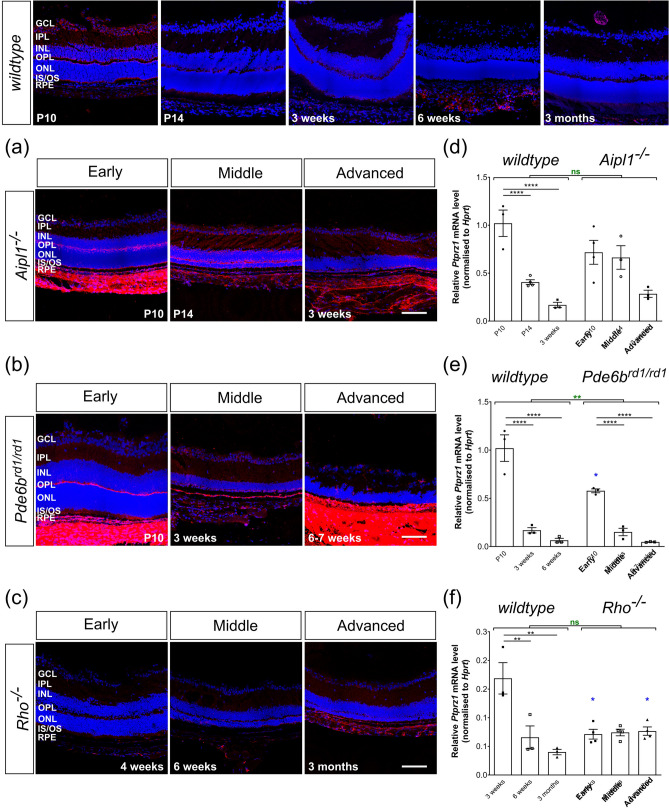
Figure 6.
Phosphacan expression decreases with time and is unaffected by degeneration. (a)–(c) Immunolabelling for Phosphacan (red) was mostly restricted to GCL, IPL and OPL. In P10 wildtype, labelling was particularly evident at the outer margin of the OPL and the edge of the ONL itself. In (a) Aipl1-/- and (b) Pde6brd1/rd1 mice, labelling was most prominent in the OPL and RPE, compared to age-matched wildtype. (c) In Rho-/- retinae, labelling was weak at all time-points. (d)–(f) Ptprz1 mRNA expression was significantly decreased with time in all models including wildtype retinae. N.B. mRNA levels shown for wildtype are the same as in Fig. 1e. Scale bar, 100 µm. *p < 0.05, **p < 0.01, ***p < 0.001, ****p < 0.0001 (one-way ANOVA test with Bonferroni’s correction, black; parametric t-test for age-matched comparisons between wildtype and disease model, blue; two-way ANOVA test applied for assessments of change over time, red). ONL—outer nuclear layer; OPL—outer plexiform layer; INL—inner nuclear layer; IPL—inner plexiform layer; GCL—ganglion cell layer. Nuclei are counter stained with Dapi (blue).

