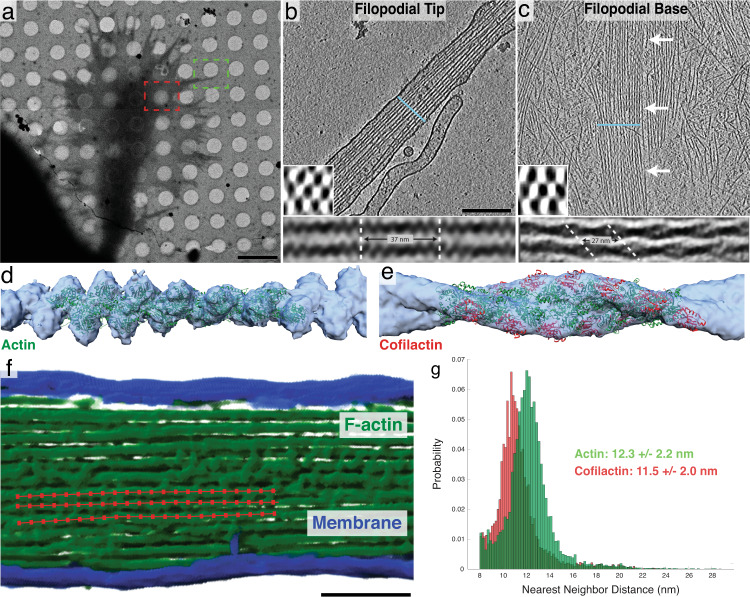
Fig. 2. Structural features of neuronal growth cone filopodia and their associated cofilactin bundles.
a Overview image of a cryo-preserved growth cone on a Quantifoil EM grid. The green and red boxes represent growth cone regions similar to where the tomograms in b and c were imaged, respectively. b, c 5 nm-thick slices of tomograms from the tip (b) and base (c) of growth cone filopodia. In b, a bundle of actin filaments fills the entire cytoplasm. In c, branched networks of individual actin filaments can be seen surrounding a central bundle of hyper-twisted cofilactin filaments. White arrows point to the bundle. Lower-left insets: 68 nm-thick transverse cross-sections through each bundle, illustrating the hexagonal packing of filaments. The blue line in the main images show the plane from which the insets were taken. Bottom insets: Subtomogram averages of filament pairs in filopodial tips (below b) or in cofilactin bundles at the filopodial bases (below c). Cofilactin filaments have a shorter helical twist than F-actin and are out of phase with adjacent filaments. d EM map (blue) resulting from the subtomogram averaging of actin filaments in filopodial tips, and rigid body fitting of a previously reported atomic structure for F-actin (PDB ID: 6T1Y; green). e EM map (blue) resulting from the subtomogram averaging of cofilactin filaments near the base of filopodia, and rigid body fitting of a previously reported atomic structure of cofilactin (PDB ID: 3J0S; actin is green and cofilin is red). f Segmented filopodial protrusion with a schematic of filament centerlines overlaid (red). These lines are comprised of a series of points that were used for nearest neighbor analysis. g Nearest neighbor histograms showing the cumulative total of three normal actin filopodial bundles (green) and three cofilactin bundles (red). Scale bars: (a) 5 µm, (b) 200 nm (this also corresponds to the image in c), f 100 nm.

