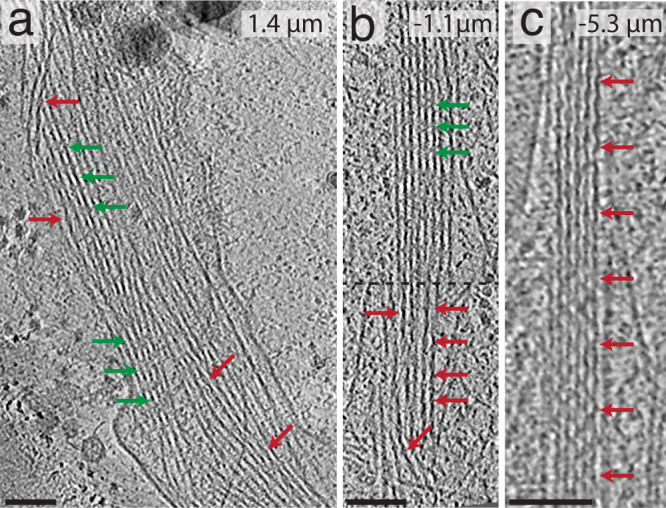
Fig. 5. Tomography of cofilactin within filopodia.

In all images, red arrows signify cofilactin and green arrows show normal F-actin. The top-right corner of each image shows their distance from the lamellipodial veil (positive values are distal from the veil and negative values are proximal from it). a A 13.3 nm-thick tomographic slice where individual cofilactin filaments are scattered throughout a fascin-linked actin bundle. b 13.3 nm-thick tomographic slice through a prospective transition region where a clear boundary (represented by the dashed line) exists between the F-actin on top and the cofilactin on bottom. c 13.3 nm-thick tomographic slice showing a pure cofilactin bundle). Scale bars: 50 nm.
