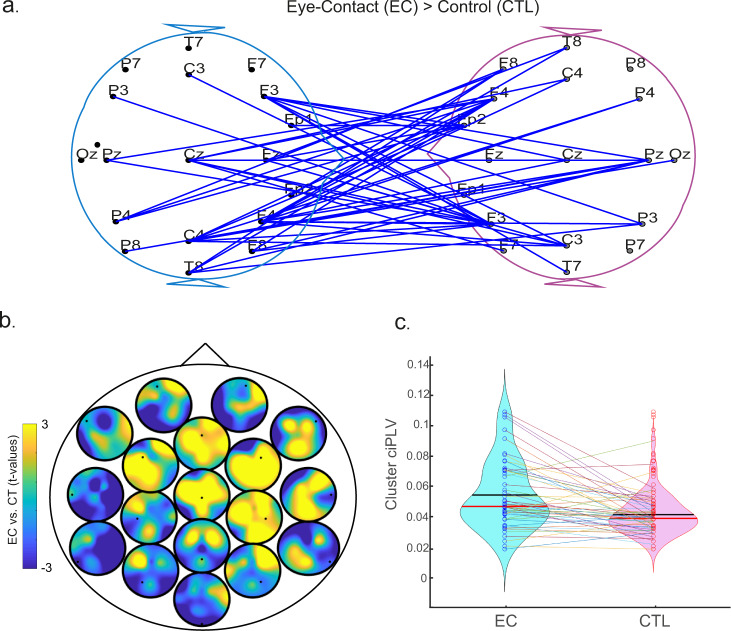
Fig. 2. Interbrain synchronization during eye contact.
Gamma-band brain synchronization (ciPLV) within pairs during eye contact (EC) vs. control condition (CTL). a Blue lines represent electrode pairs with significantly higher gamma synchronization in EC compared to CTL. The significant cluster shows widespread connections between brains, especially distributed on the right hemisphere. b Heads-in-head representation of the difference in gamma synchronization during eye contact compared to the control task for the inter-brain connections. Each circle represents the scalp topography of the connections with the channel highlighted inside as a black dot. The colours represent differences in phase synchronization between that channel (dot) and the other person’s scalp during eye contact expressed as a t-value of the contrast through the cluster permutation analysis. Yellow colours represent higher t-values for synchronization during eye-contact compared to control. c Violin plots showing the mean (red) and median (black) gamma synchronization for the cluster of interbrain connections (highlighted in blue in a) during eye contact and during the control task. Each datapoint is displayed in the figure and the lines show the changes for each pair—from eye contact (EC) to control (CTL).

