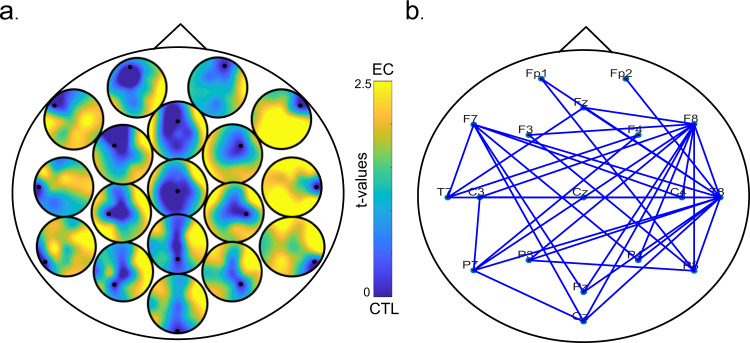
Fig. 3. Intrabrain synchronization during eye contact.
Significant cluster of intra-brain connectivity during eye contact (EC) compared to no eye contact (CTL). a Heads-in-head representation of the difference in gamma phase synchronization during eye contact compared to the control task. Each circle represents the topography of the connections with the channel marked as a small dot. Yellow colours represent an increase in phase synchronization during eye contact expressed as a t-value of the contrast as conducted in the cluster permutation analysis. b Significant connections in the observed gamma frequency cluster. Most significant connections are between right parietal and the rest of the brain.

