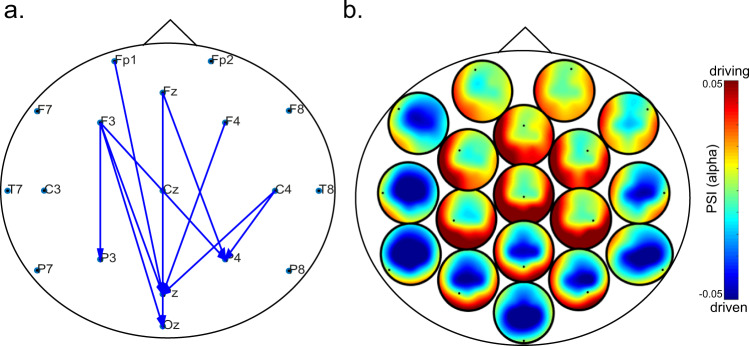
Fig. 6. Directed phase synchronization intrabrain clusters during eye contact in the alpha band.
a The arrows show the significant connections for the cluster observed in the alpha band during eye contact compared to the control task (eye contact > control). b Heads-in-head plot showing the distribution of the PSI across the scalp for all electrodes. Each subtopography plot displays how the electrode represented as a dot (labels on a) relates to the rest of the scalp. For example, the central midline electrode (Cz) appears as the driver of the alpha phase of the posterior electrodes. Overall, there is a pattern of frontal regions driving posterior areas, which were higher during eye contact compared to control (a).

