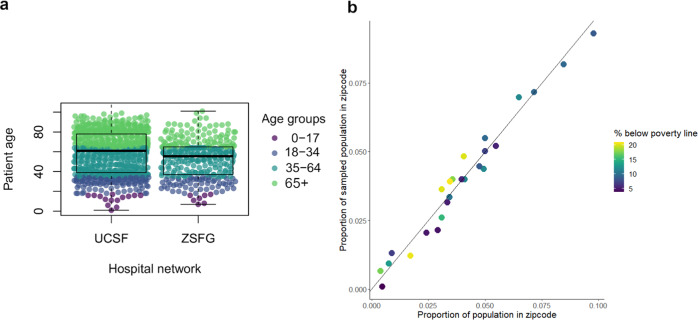
Fig. 1. Sample characteristics.
a Age distribution by health network of sample collection within the University of California, San Francisco (UCSF) (N = 698 biologically independent samples) and San Francisco Department of Public Health (ZSFG) hospital networks (N = 316 biologically independent samples). Each point represents a sample and colors correspond to age bins used for analysis. The box plot whiskers show the maximum and minimum ages, the box shows the 25-75th percentile values for age, and the central line within the boxplot represents the median age within each health network. b Proportion of samples from a given San Francisco zipcode plotted against the proportion of the San Francisco population within that zipcode. Colors show the percentage of residents below the poverty line within that zipcode, as determined by the American Community Survey 201915, using census bureau definitions of poverty thresholds35.

