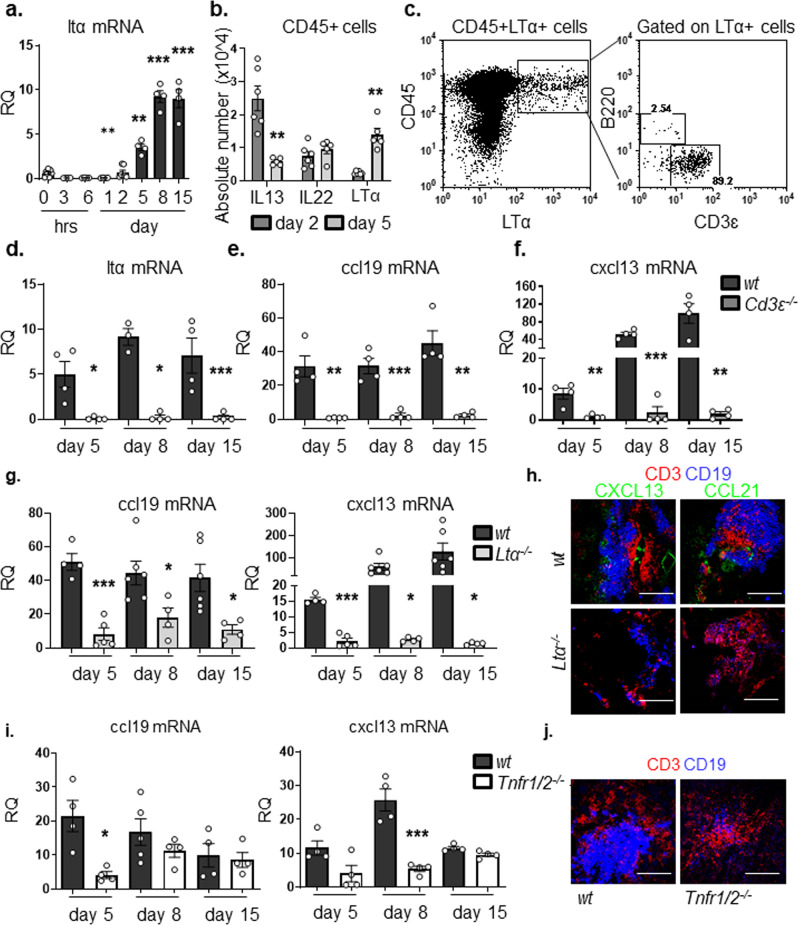
Fig. 1. LTα3 is responsible for chemokine production within newly formed TLSs.
a qPCR analysis of ltα mRNA transcripts from wt (black bars) salivary glands at day 0, 3 h, 6 h, day 1, day 2, day 5, day 8 and day 15 p.c. Gene expression was normalized to housekeeping gene β-actin and expressed as RQ values relative to day 0 mRNA transcripts results. b CD45+ cells expressing IL13, IL22 or LTα3 at day 2 p.c. (grey bars) and day 5 p.c. (white bars) in wt mice. c Enumeration of LTα + lymphocytes within the CD45+ cells in wt salivary glands at day 5 p.c. by flow cytometry. Representative dot plot of LTα expression in CD45+ cells and its frequency within CD3ε+ and B220+ cells. d–f Graphs showing qPCR analysis of ltα (d), ccl19 (e) and cxcl13 (f) mRNA transcripts from wt (black bars) and Cd3ε−/− (dark grey bars) salivary glands at day 5, 8 and day 15 p.c. g Quantification of ccl19 and cxcl13 mRNA transcripts from wt (black bars) and Ltα−/− (light grey bars) salivary glands at day 5, 8 and 15 p.c. In all cases, gene expression was normalized to housekeeping gene β-actin and expressed as RQ values relative to day 0 mRNA transcripts results. h Immunofluorescence staining in salivary glands from wt and Ltα−/− mice for lymphoid aggregates with CD3ε (red), CD19 (blue) and CXCL13 or CCL21 (green) at day 15 p.c. Scale bar 100 µm. i qPCR analysis of ccl19 and cxcl13 mRNA transcripts from wt (black bars) and Tnfr1/2−/− (white bars) salivary glands at day, 5, 8 and 15 p.c. Chemokine mRNA transcript results were normalized to β-actin. j Immunofluorescence staining for lymphoid aggregates within infected salivary glands from wt and Tnfr1/2−/− mice with CD3ε (red) and CD19 (blue) at day 8 p.c. Scale bar 100 µm. Data are mean ± s.e.m from two independent experiments with three to six mice analyzed per group. *p < 0.05; **p < 0.01; ***p < 0.001, one-way ANOVA with Dunnett’s multiple comparison test (a) and unpaired t test (b, d, e, f, g, i).

