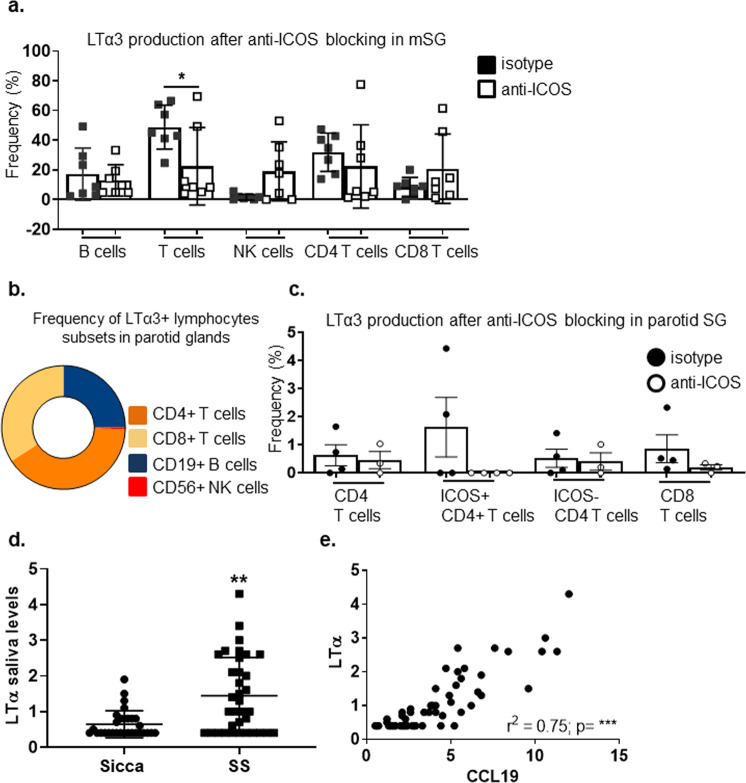
Fig. 5. ICOS-ICOSL interaction influences LTα3 production in the salivary glands of patients with Sjogren’s syndrome and MALT lymphoma.
a Graph showing frequency of LTα3 producing lymphocyte populations in mSGs biopsies (n = 7) treated with anti-ICOS (white squares) or as compared isotype antibody (black squares) treatment ex vivo. *p < 0.05, Mann–Whitney test. Data are representative as mean ± s.d. b Diagram showing LTα3 producing lymphocyte populations in MALT-parotid SG biopsies. c Graph showing percentage of LTα3 producing lymphocyte populations in MALT-parotid SG biopsy treated ex vivo with anti-ICOS (white circles) or as compared isotype antibody (black circles). Data are representative as mean ± s.d. d Graph showing saliva levels of LTα in sicca and Sjӧgren syndrome patients. **p < 0.01, Mann–Whitney test. Data are representative as mean ± s.d. e Graph showing linear regression analysis to confirm correlation between LTα and CCL19 detected in saliva of Sjӧgren syndrome.

