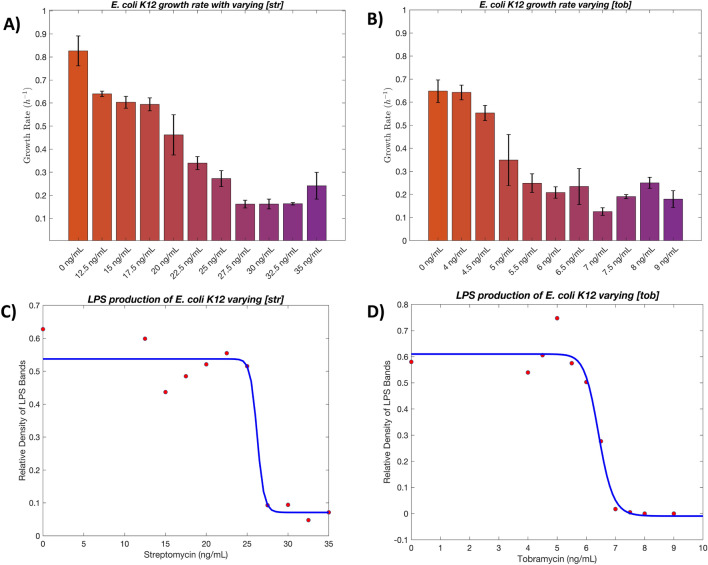
Figure 9.
(A) and (B) Calculated growth rate in absorbance increase per hour as determined by the first derivative of a growth curve for streptomycin and tobramycin respectively. Samples from the growth assay are processed and ran on a polyacrylamide gel where the pixel density of LPS bands were determined over the various concentrations and plotted as sigmoid curves for streptomycin (C) and tobramycin (D). IC50 values were determined from the inflection point of these fittings at 6.4 ± 0.1 and 26.2 ± 1.0 ng/mL for tobramycin and streptomycin respectively.

